GABAPENTIN
Formulation
The table below describes the formulation of gabapentin and the controls morphine sulfate and oxycodone hydrochloride for the following in vivo experiments.
| Experiment(s) | Compound | Dose(s) mg/kg | Correction factor | Dose volume mL/kg | Route | Vehicle | Suspension / Solution |
|---|---|---|---|---|---|---|---|
| Pharmacokinetics | Gabapentin | 60, 100 | 1.00 | 5 | PO | Saline | Solution |
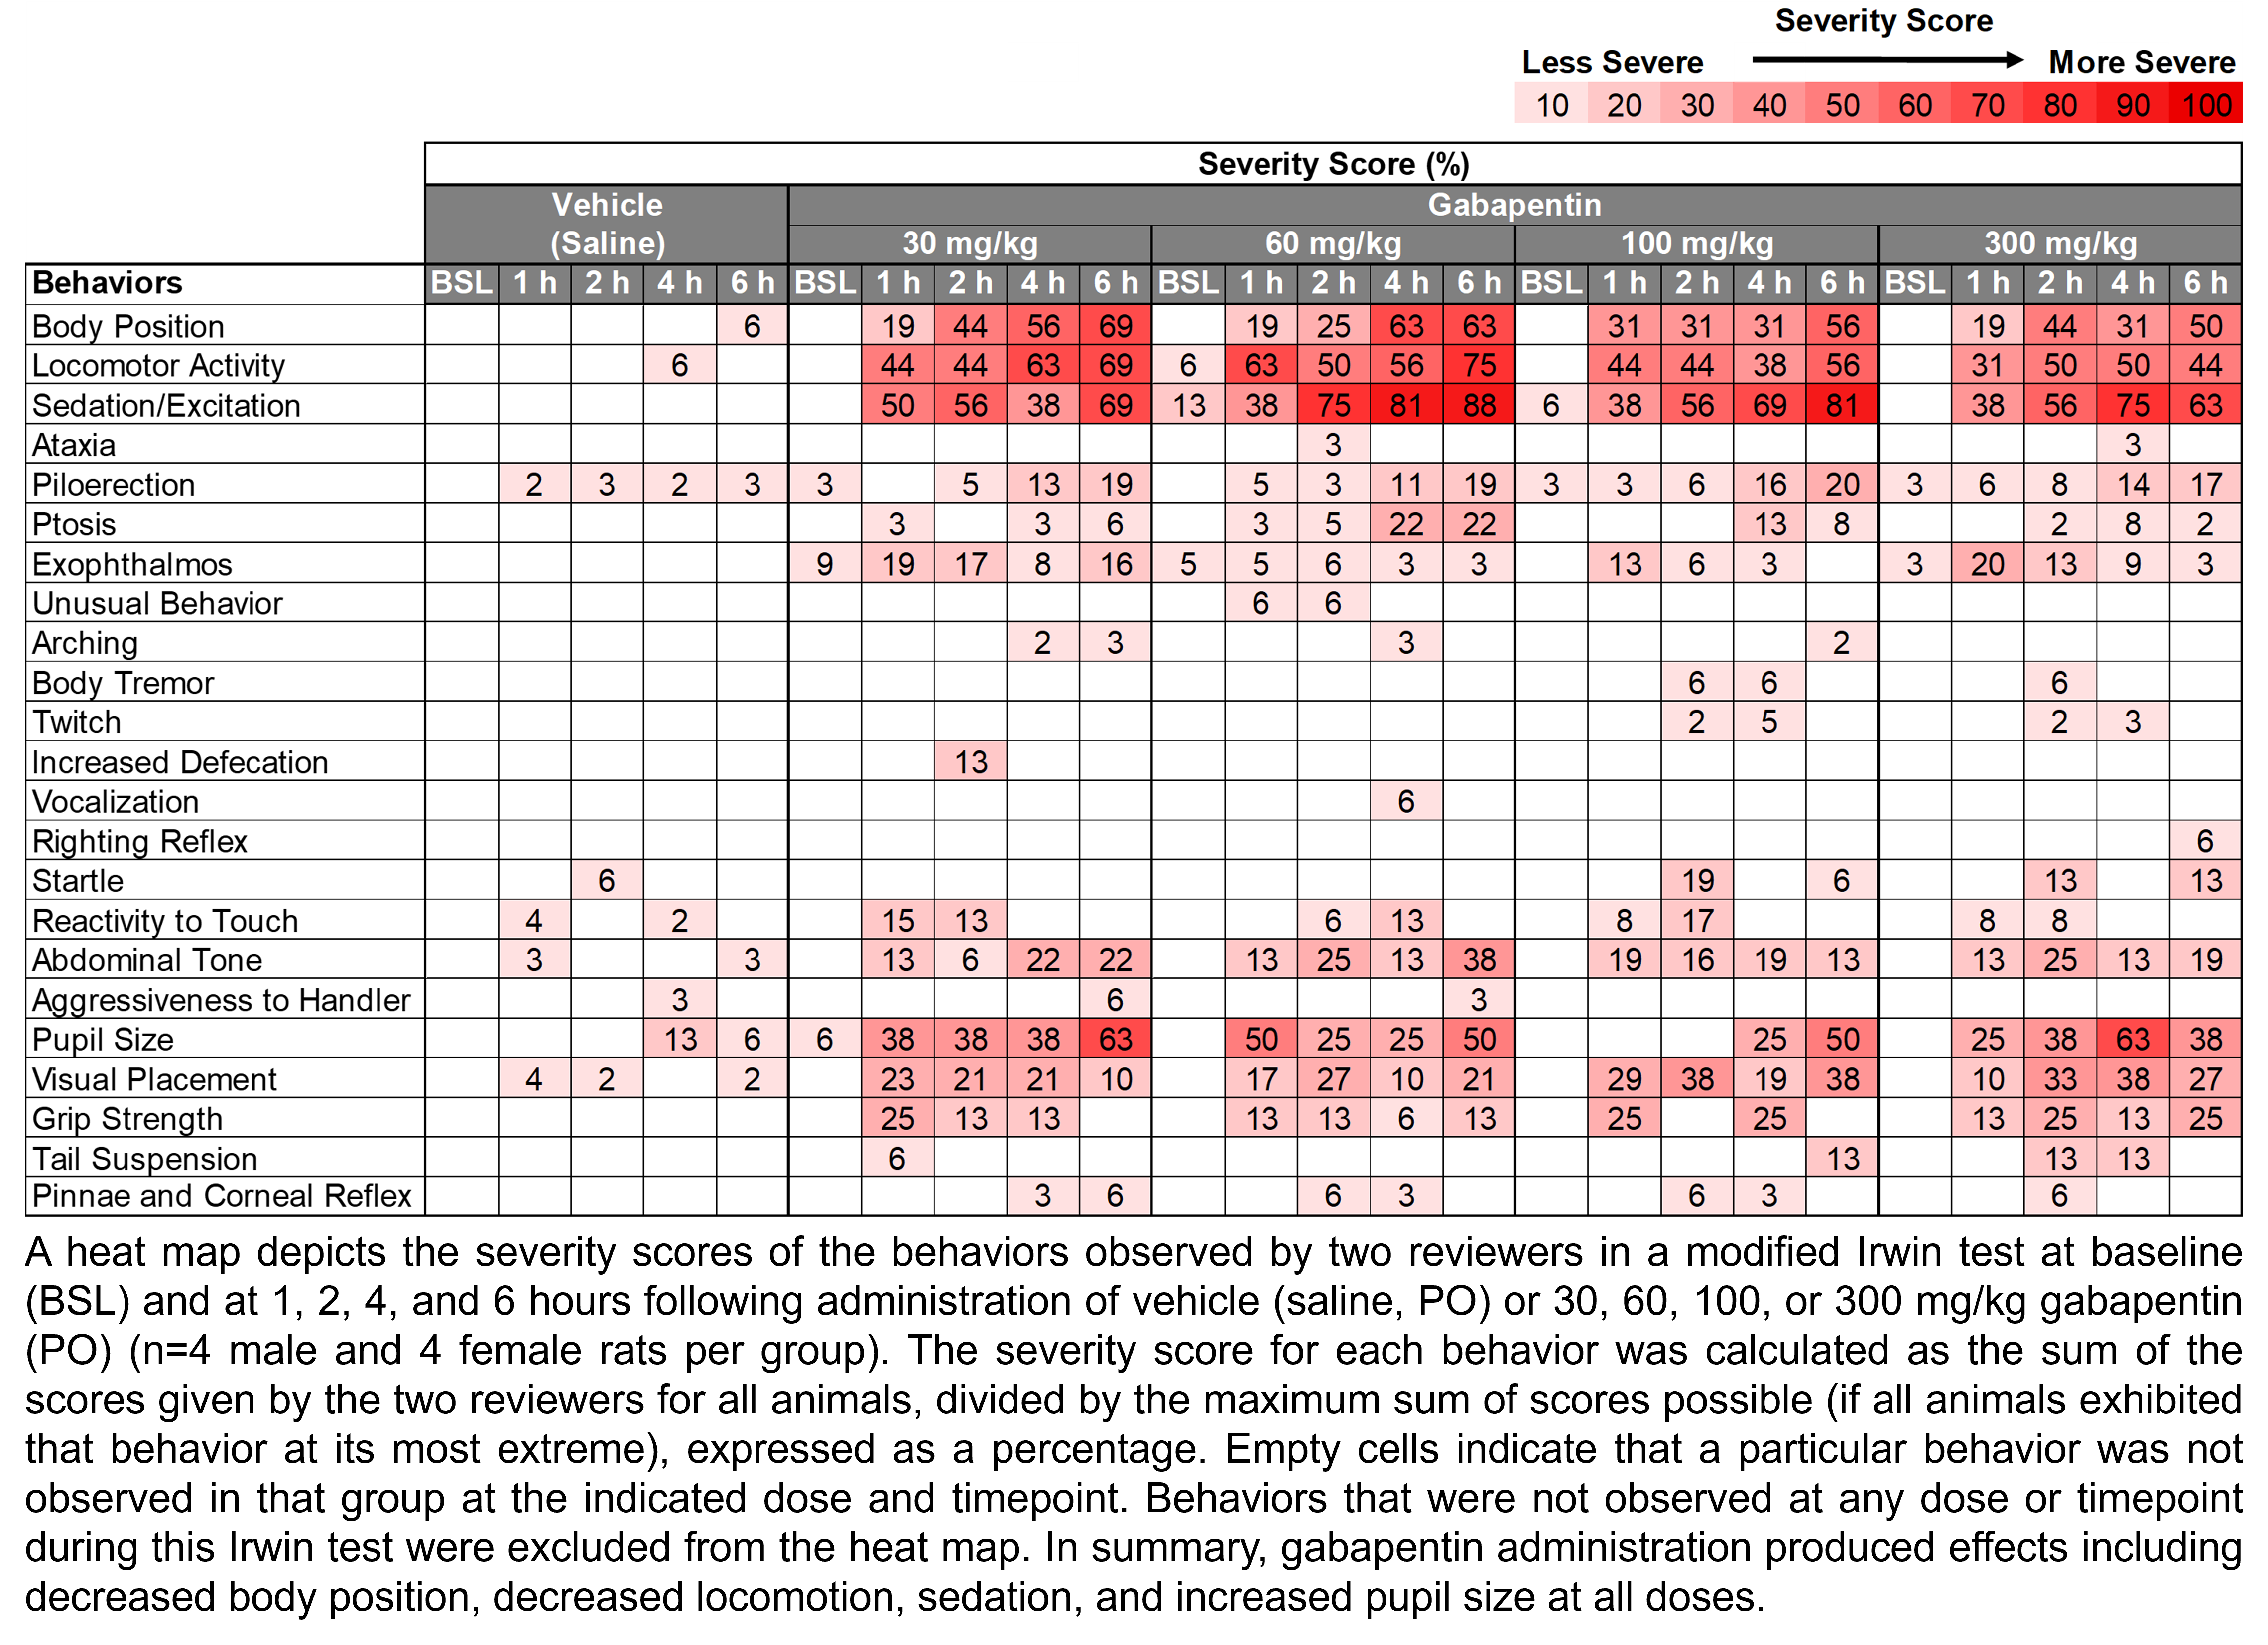
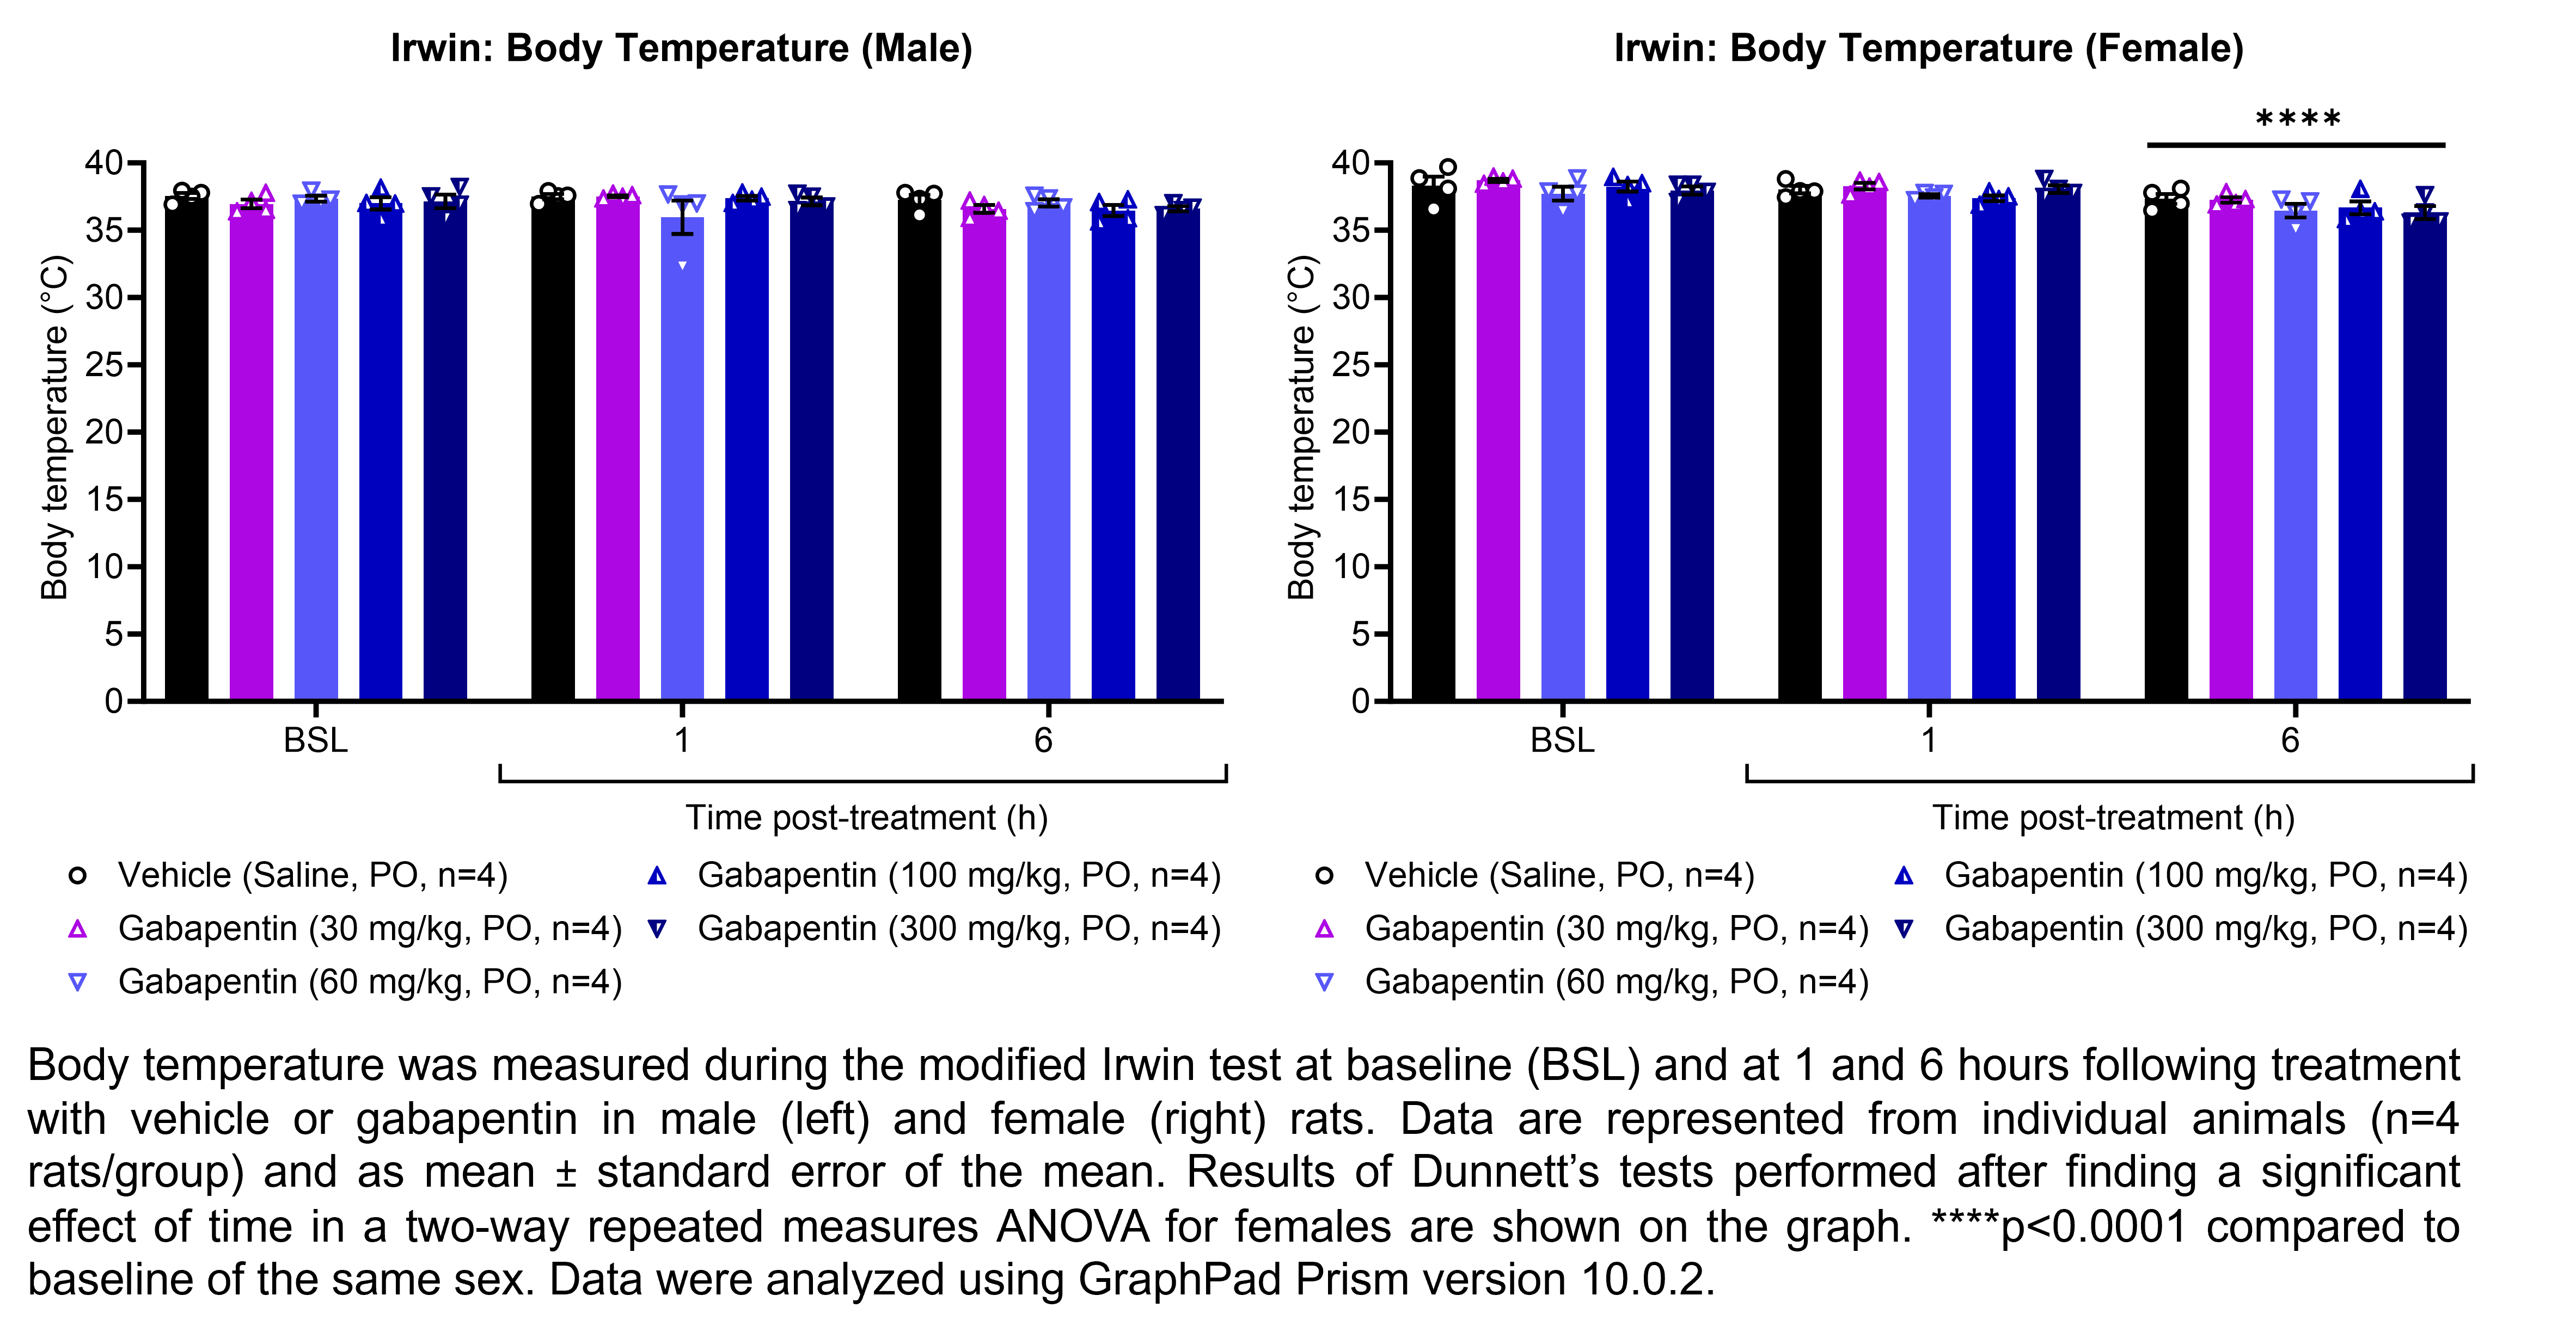
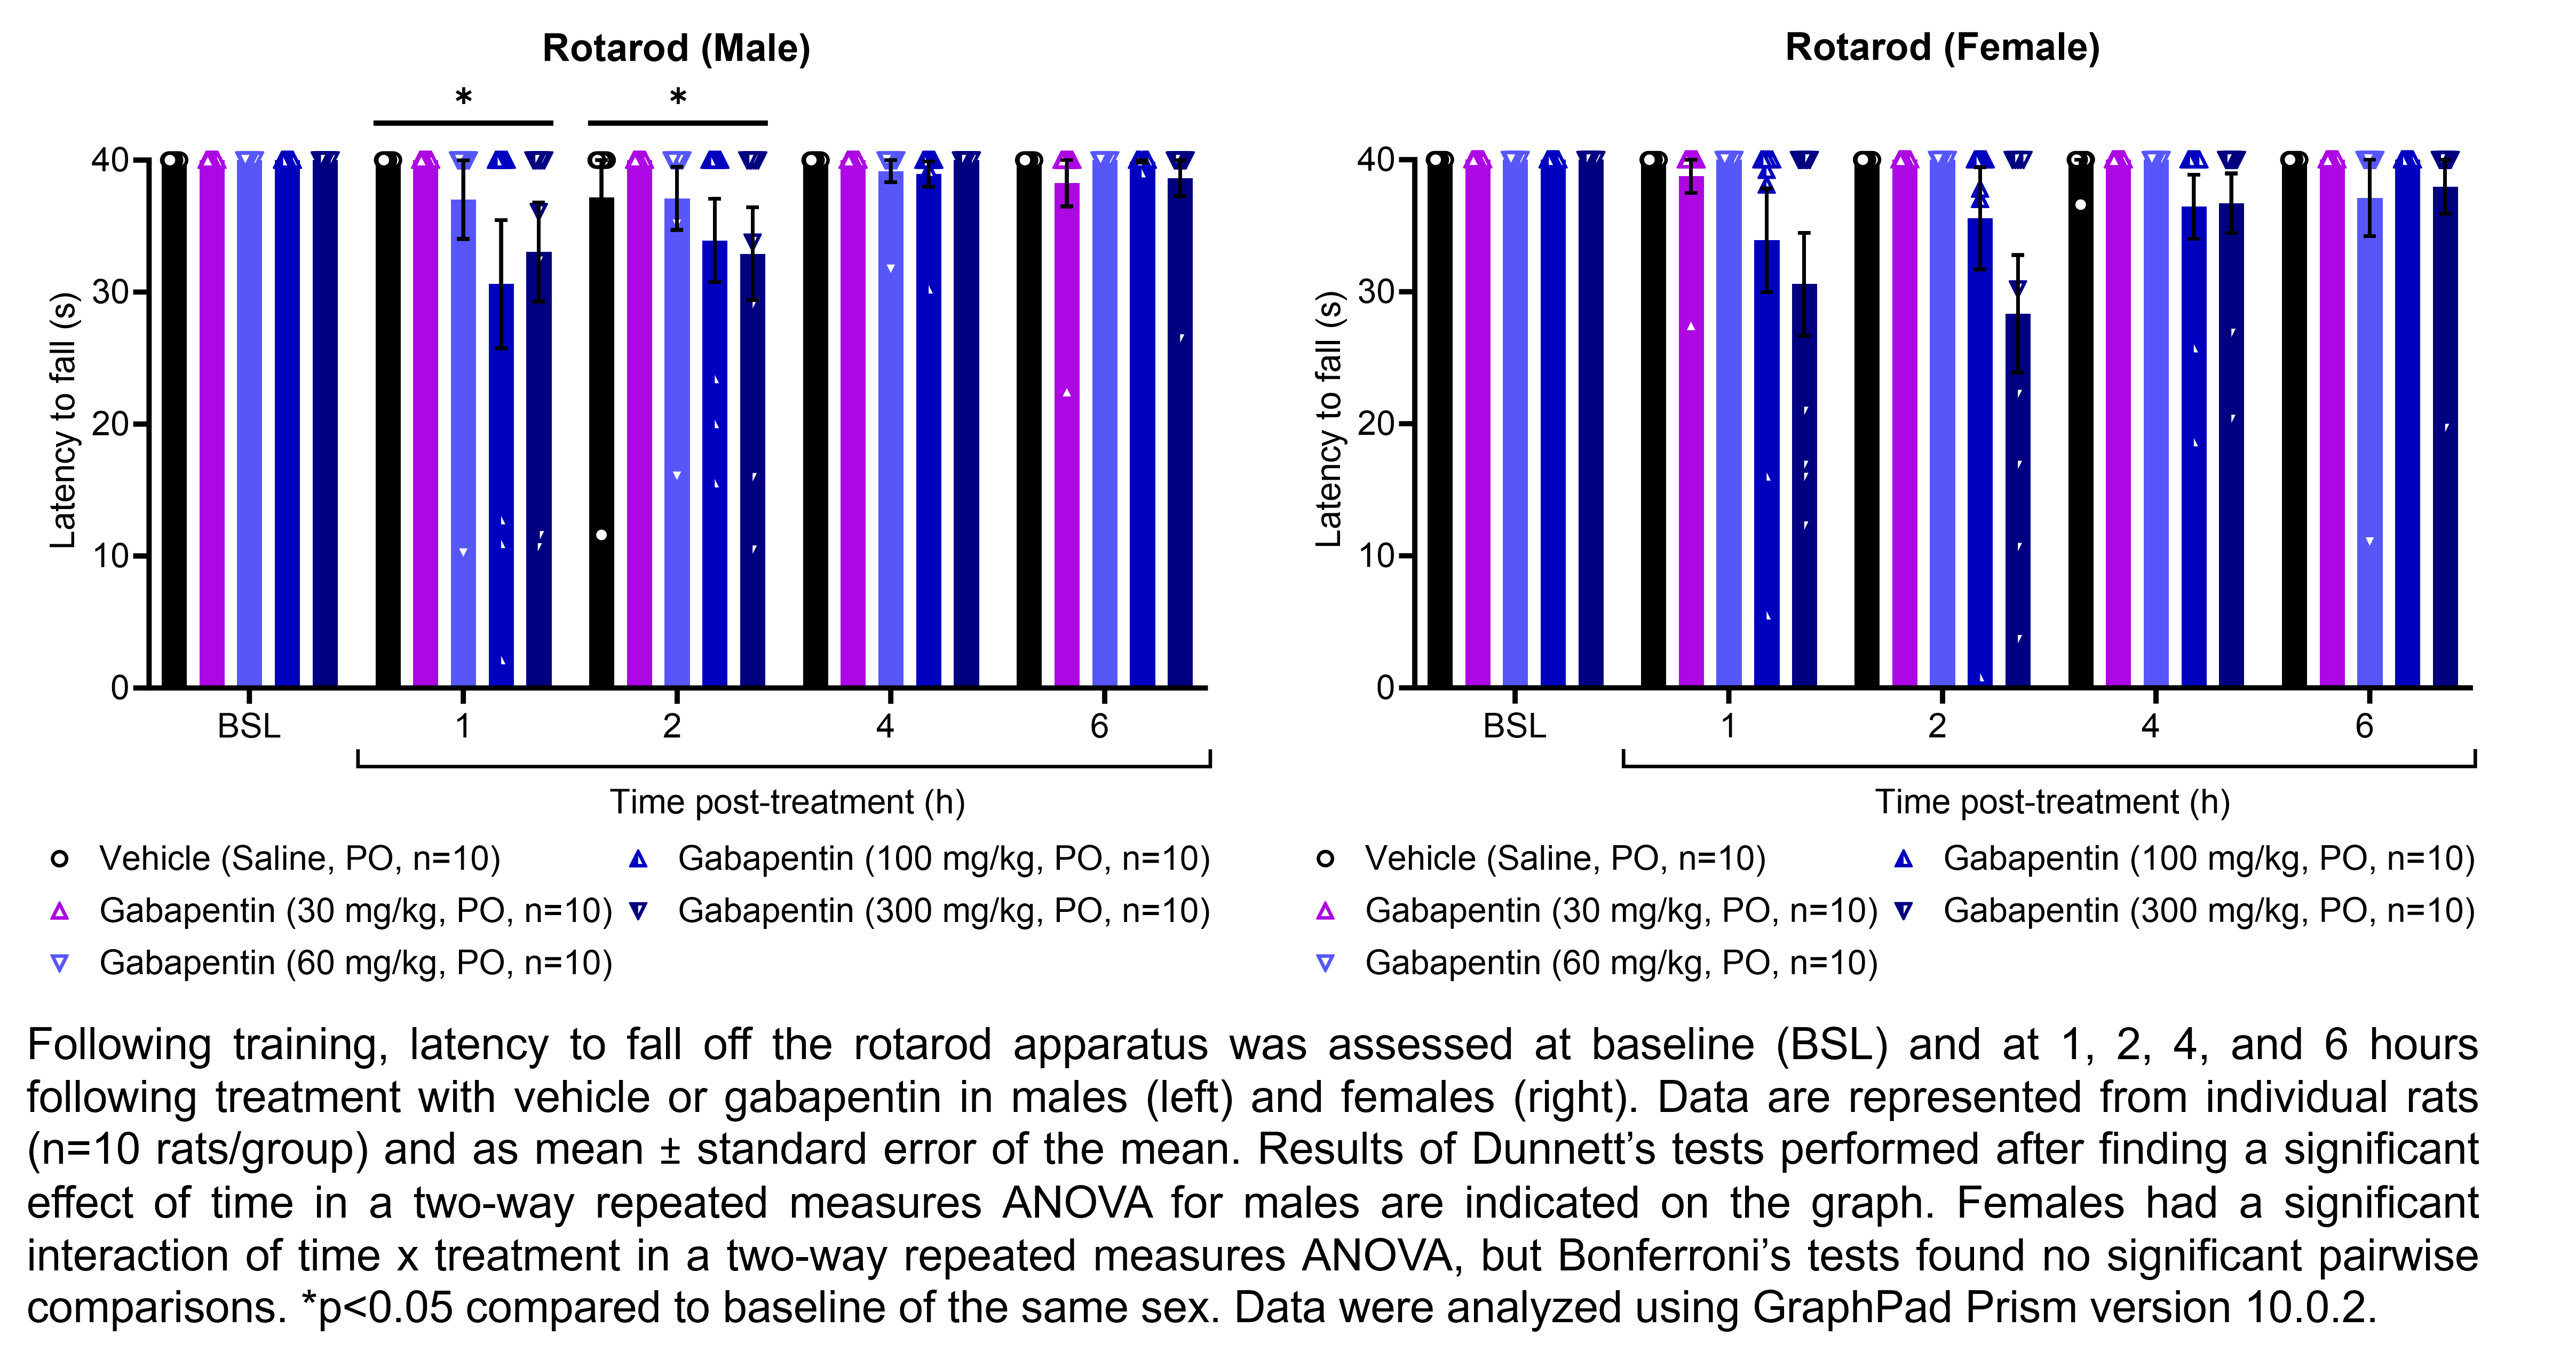
| Irwin, Rotarod | Gabapentin | 30, 60, 100, 300 | 1.00 | 5 | PO | Saline | Solution |
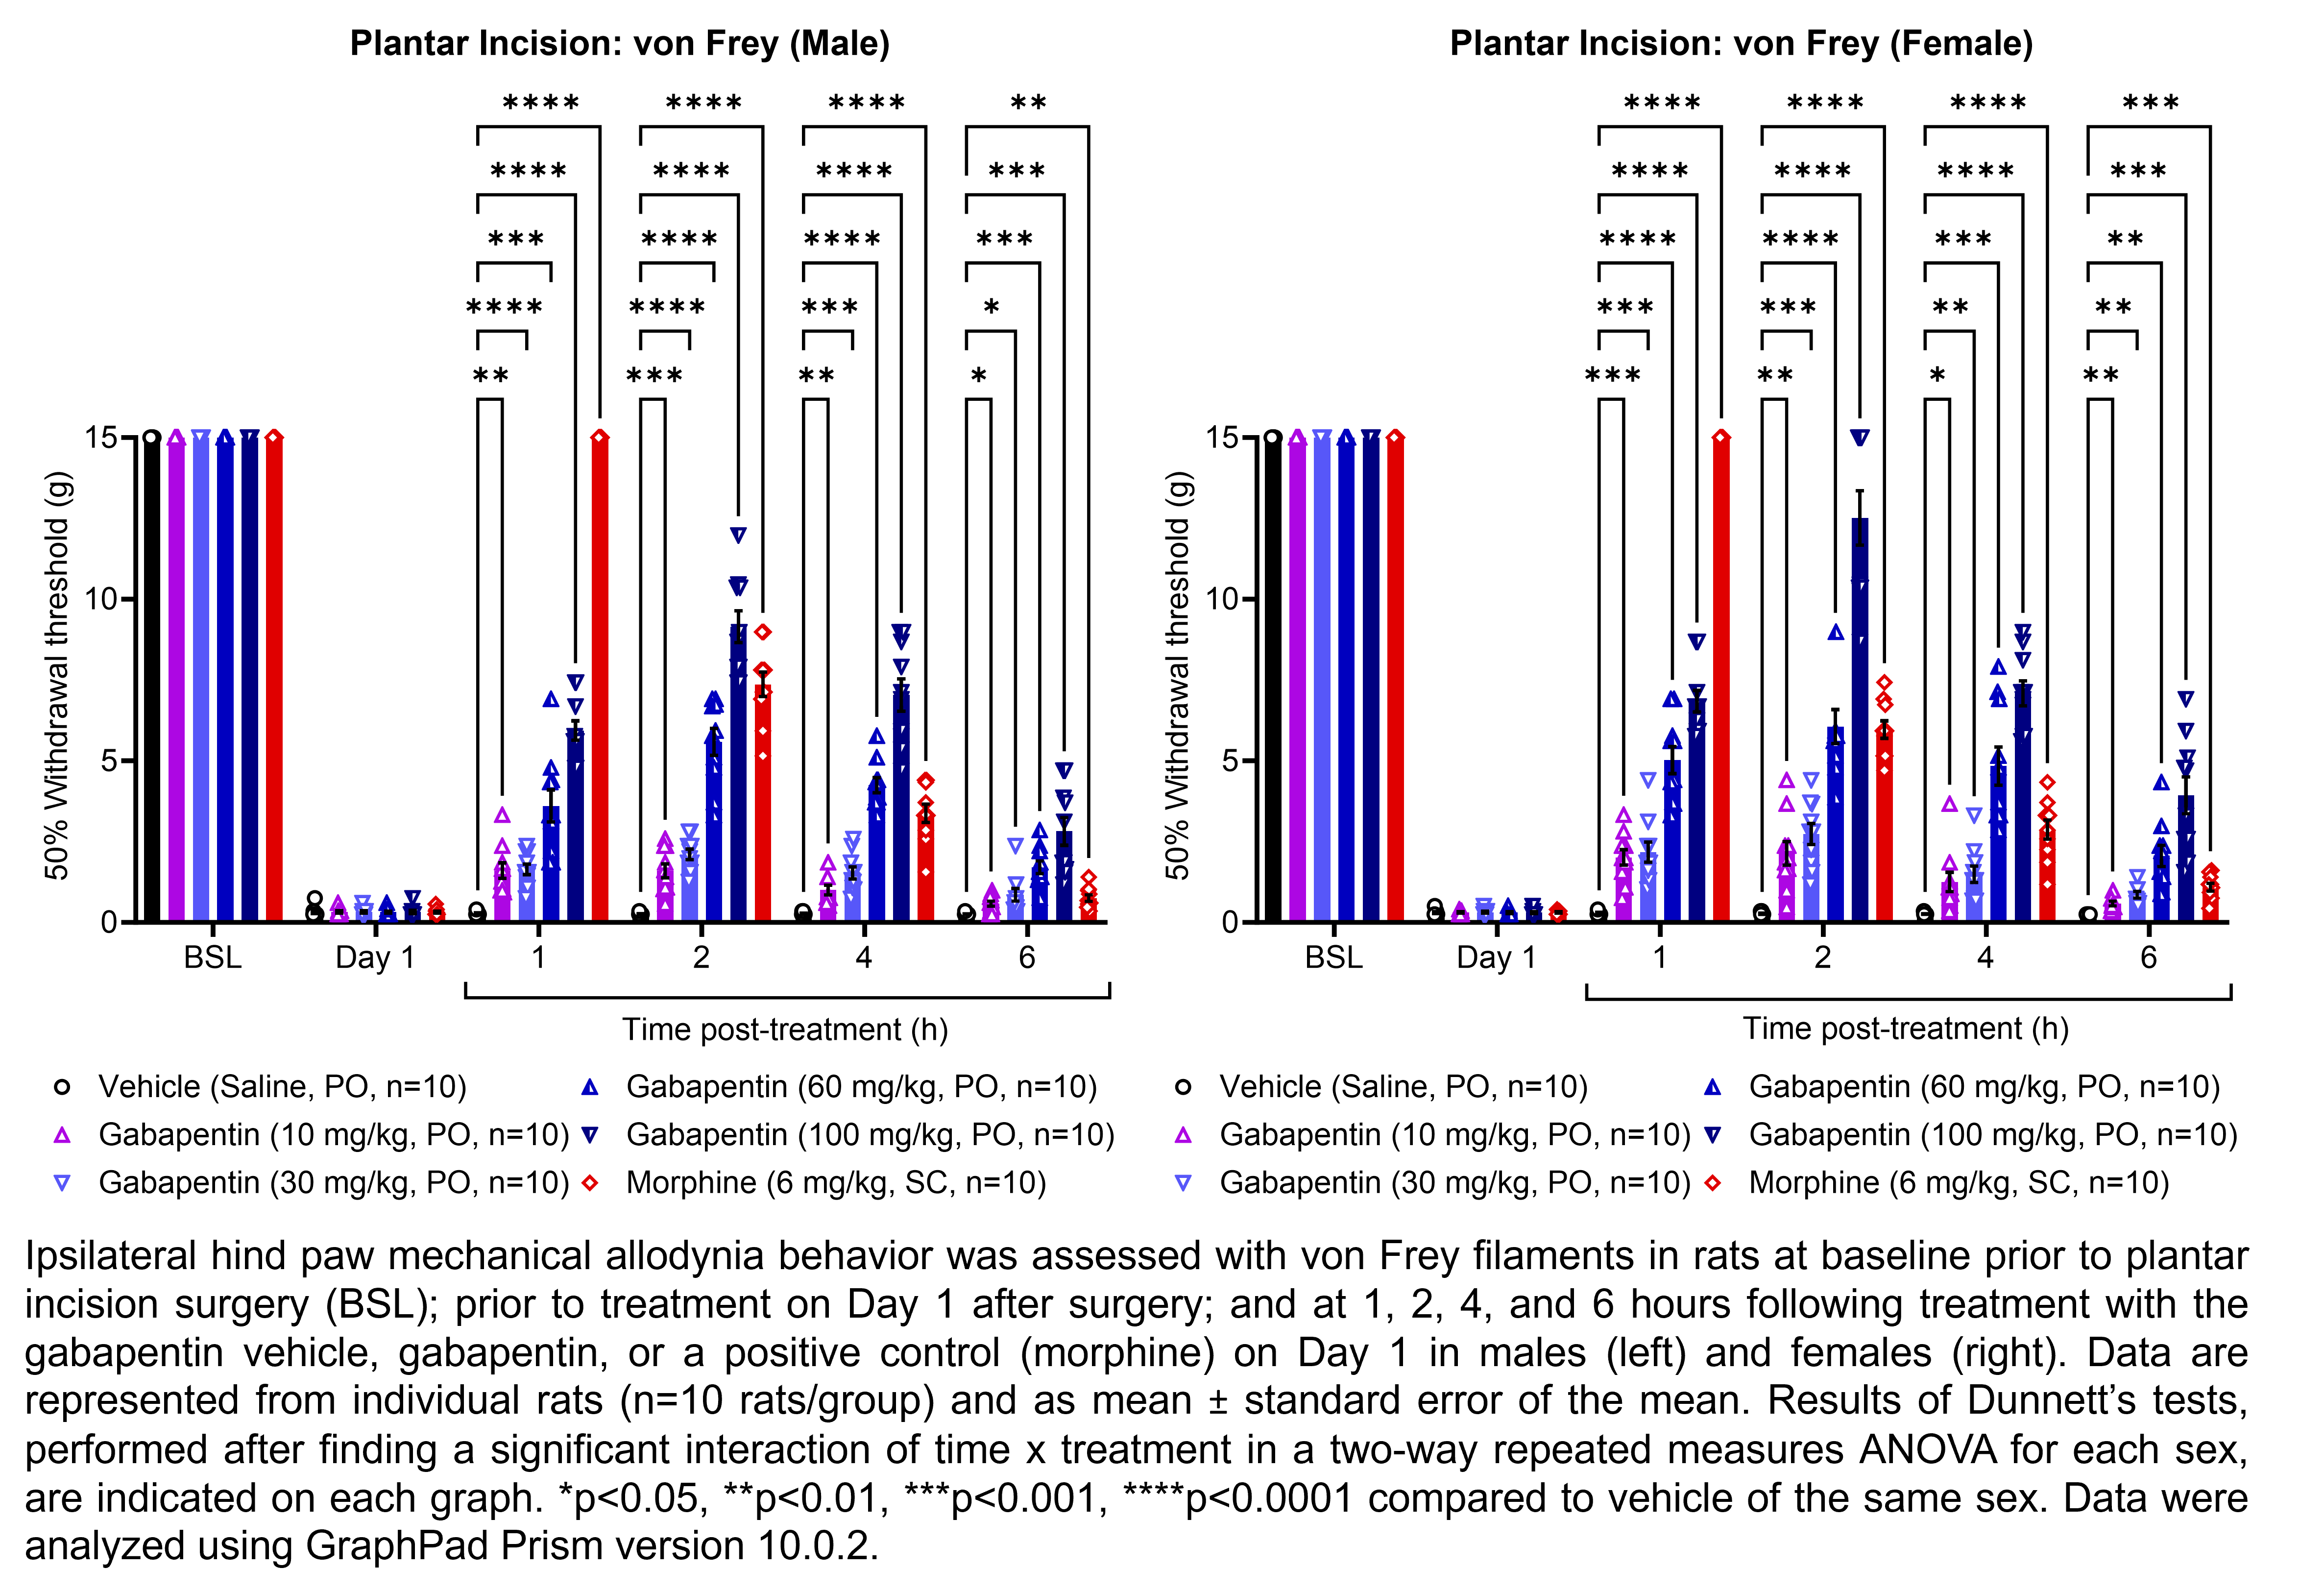
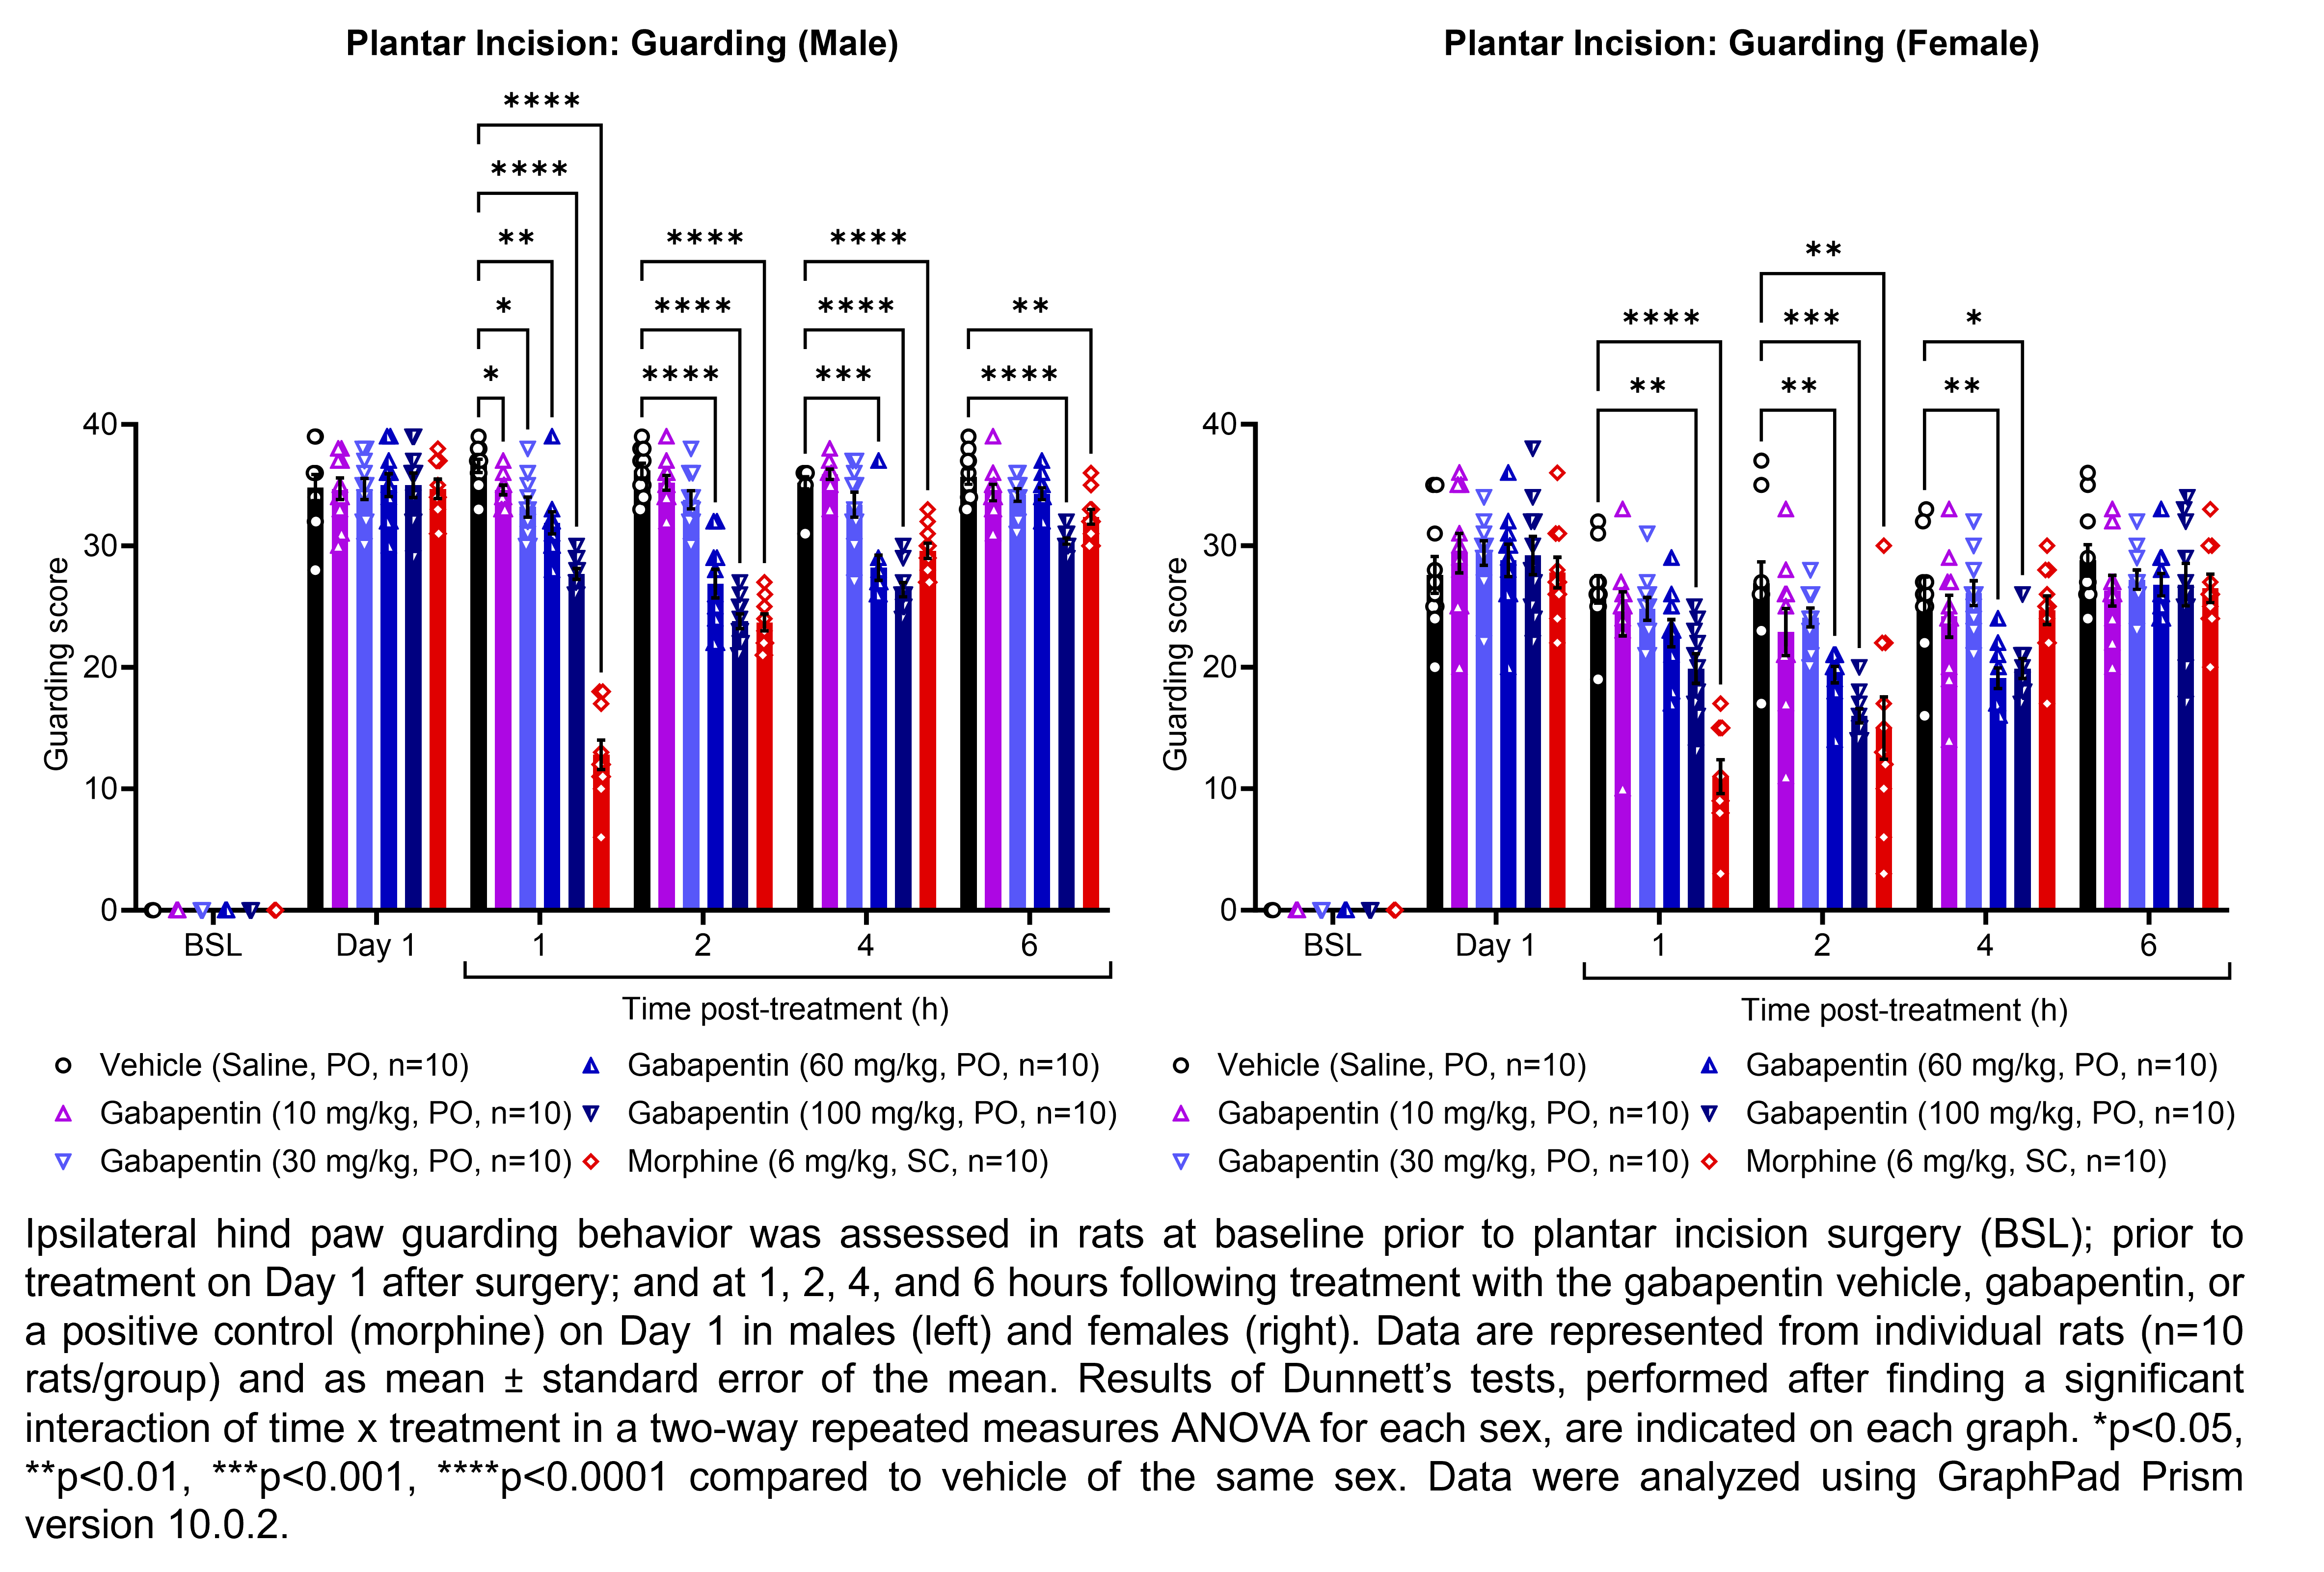
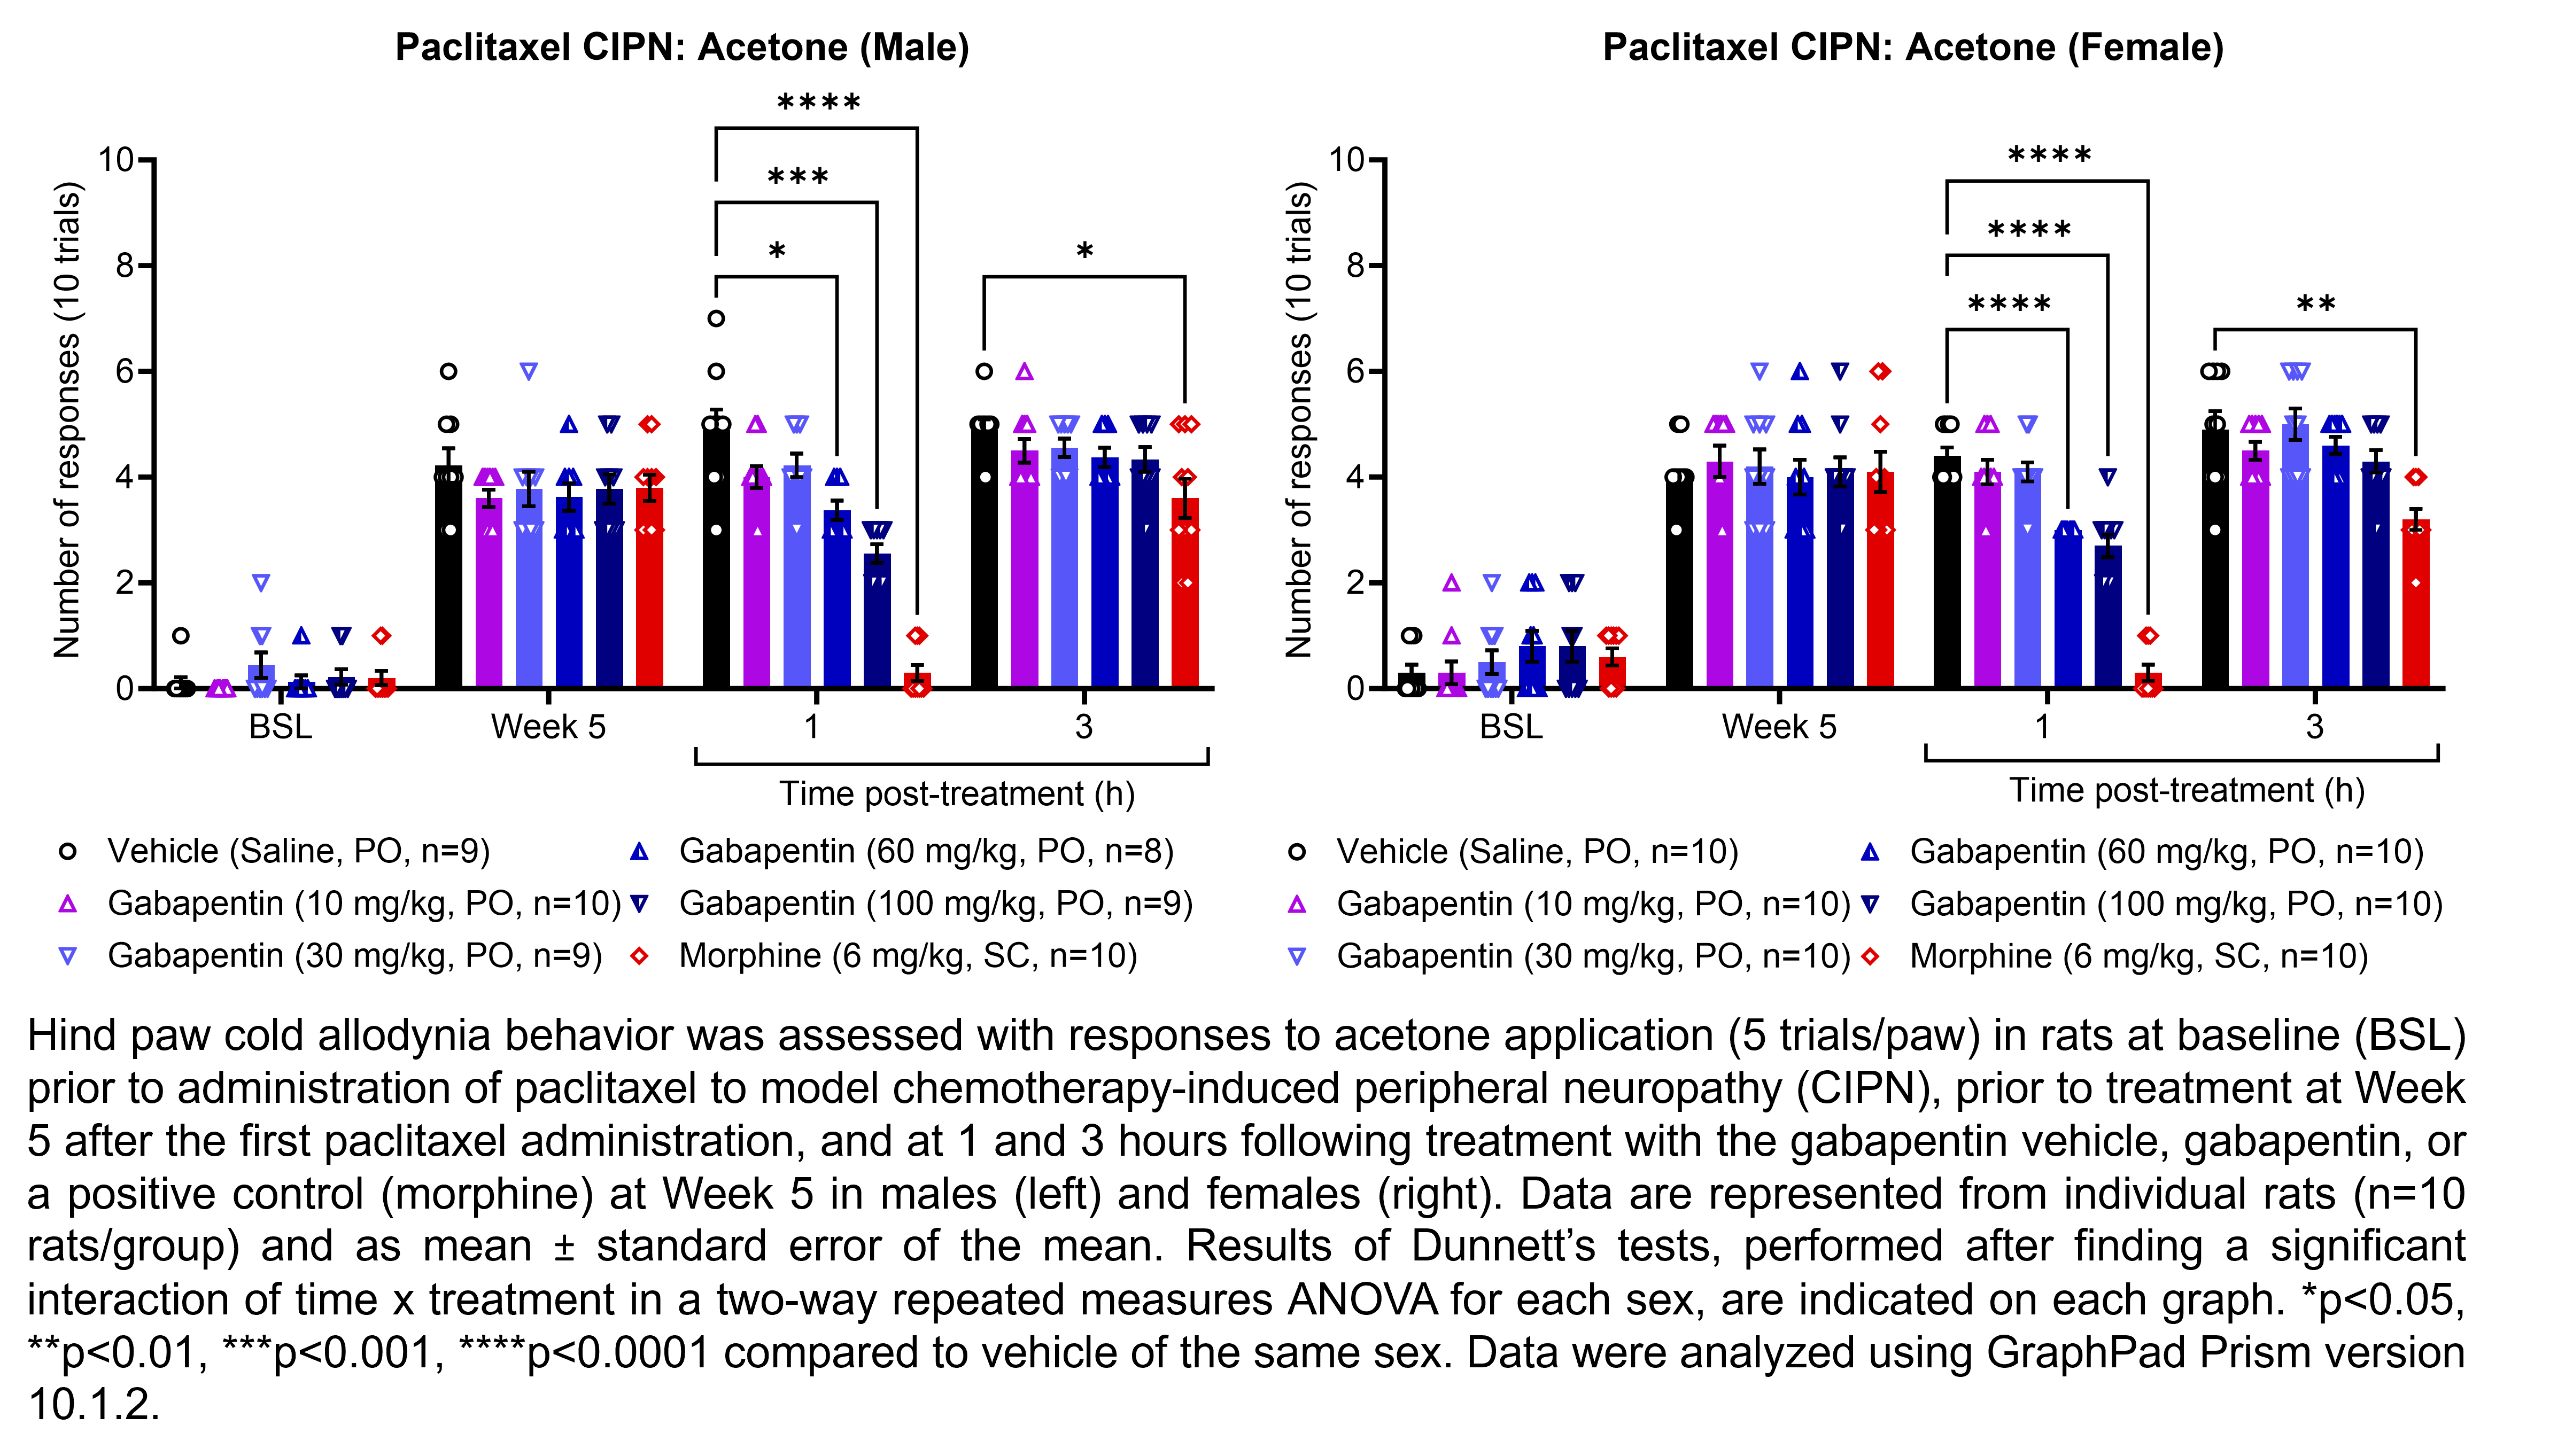
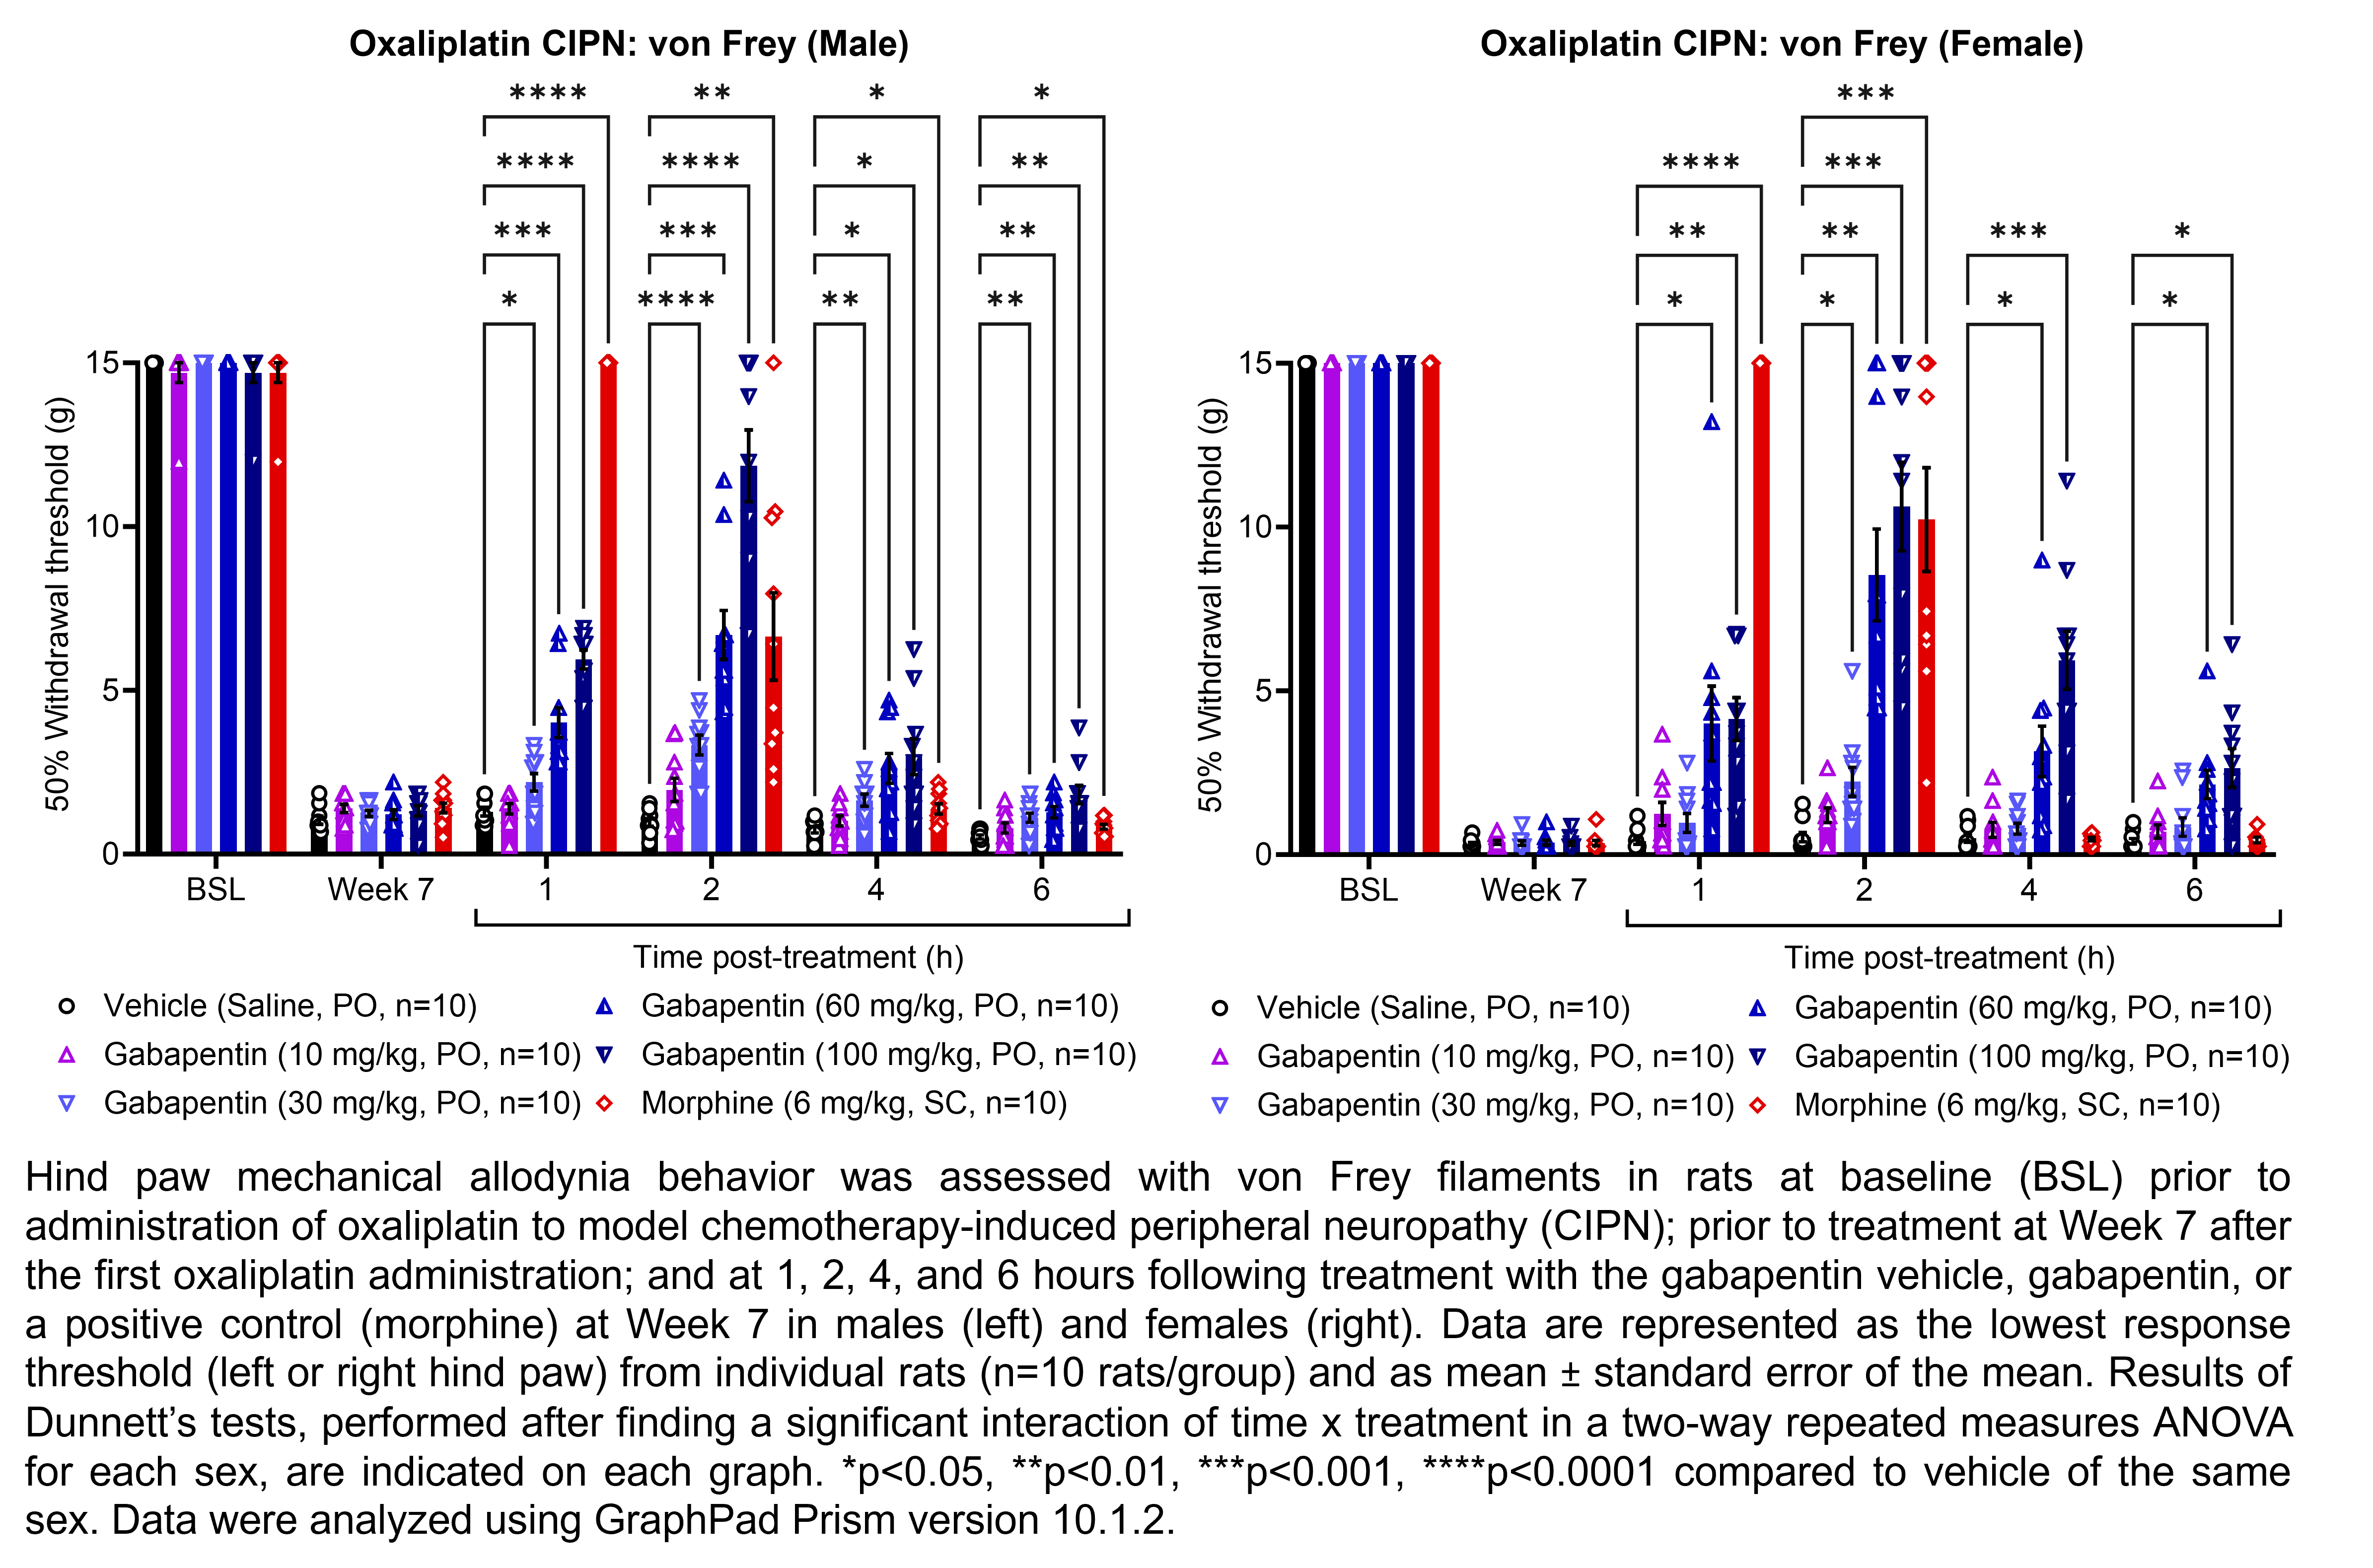
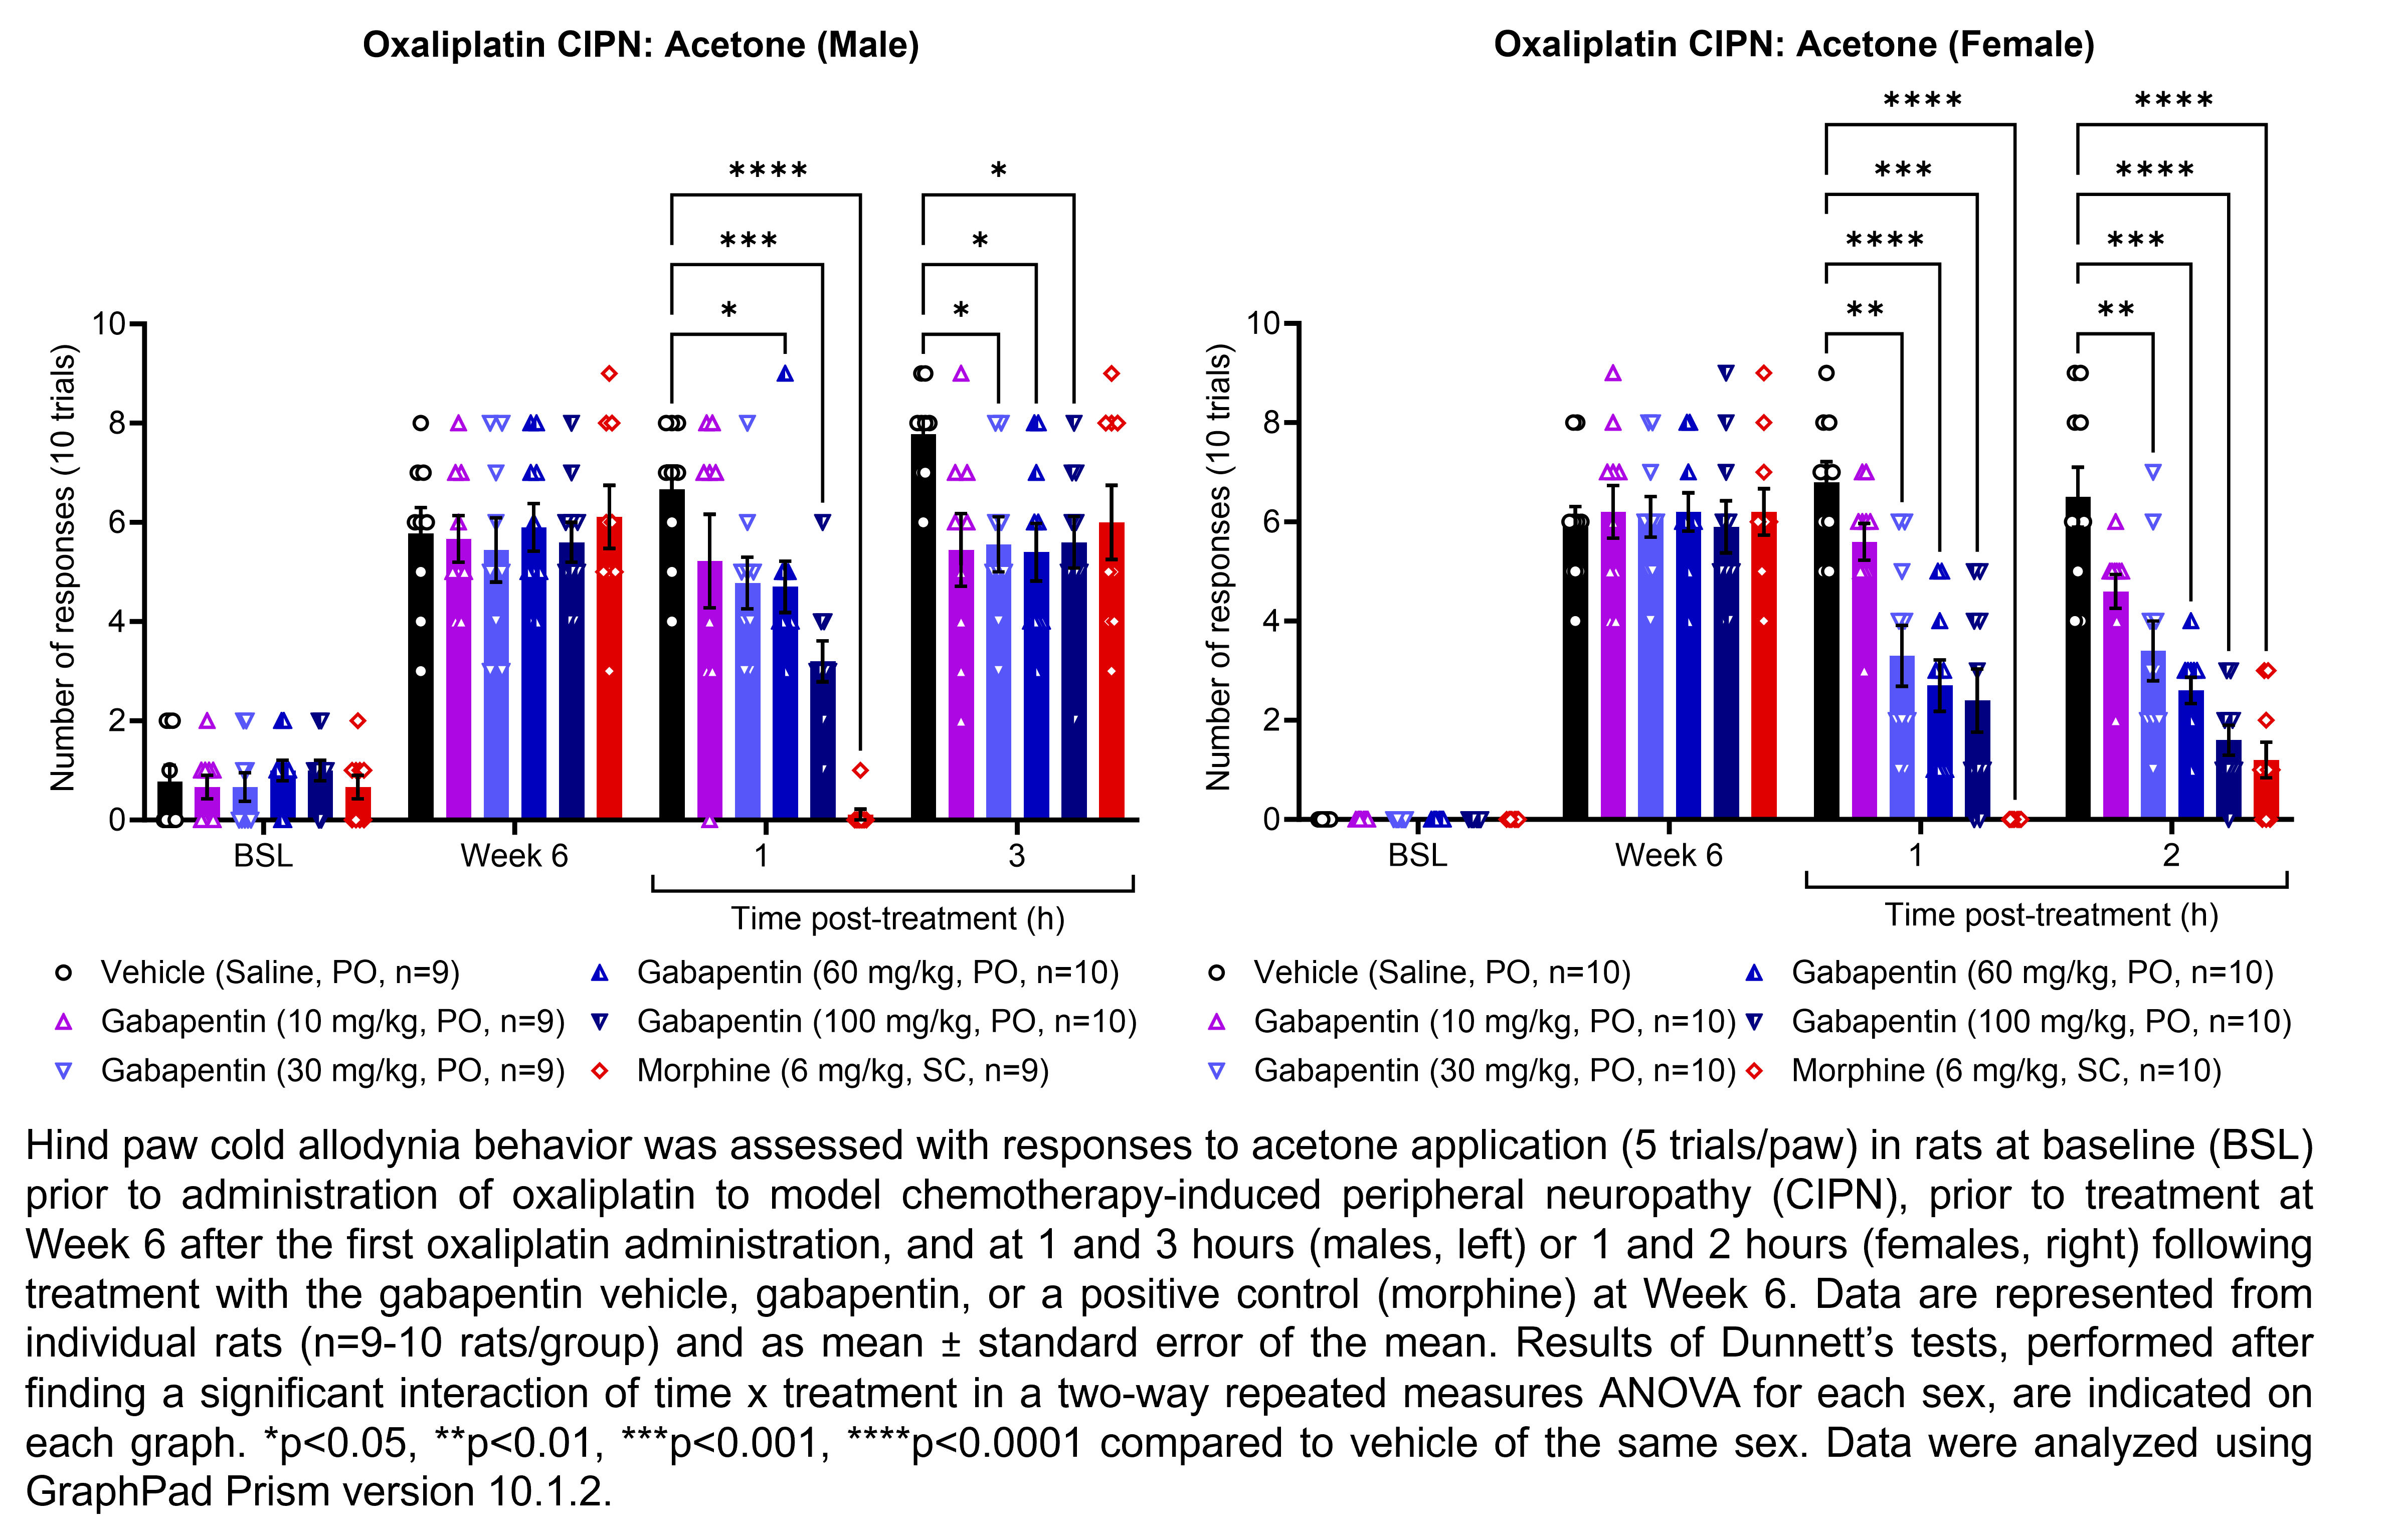
| Plantar incision, | Gabapentin | 10, 30, 60, 100 | 1.00 | 5 | PO | Saline | Solution |
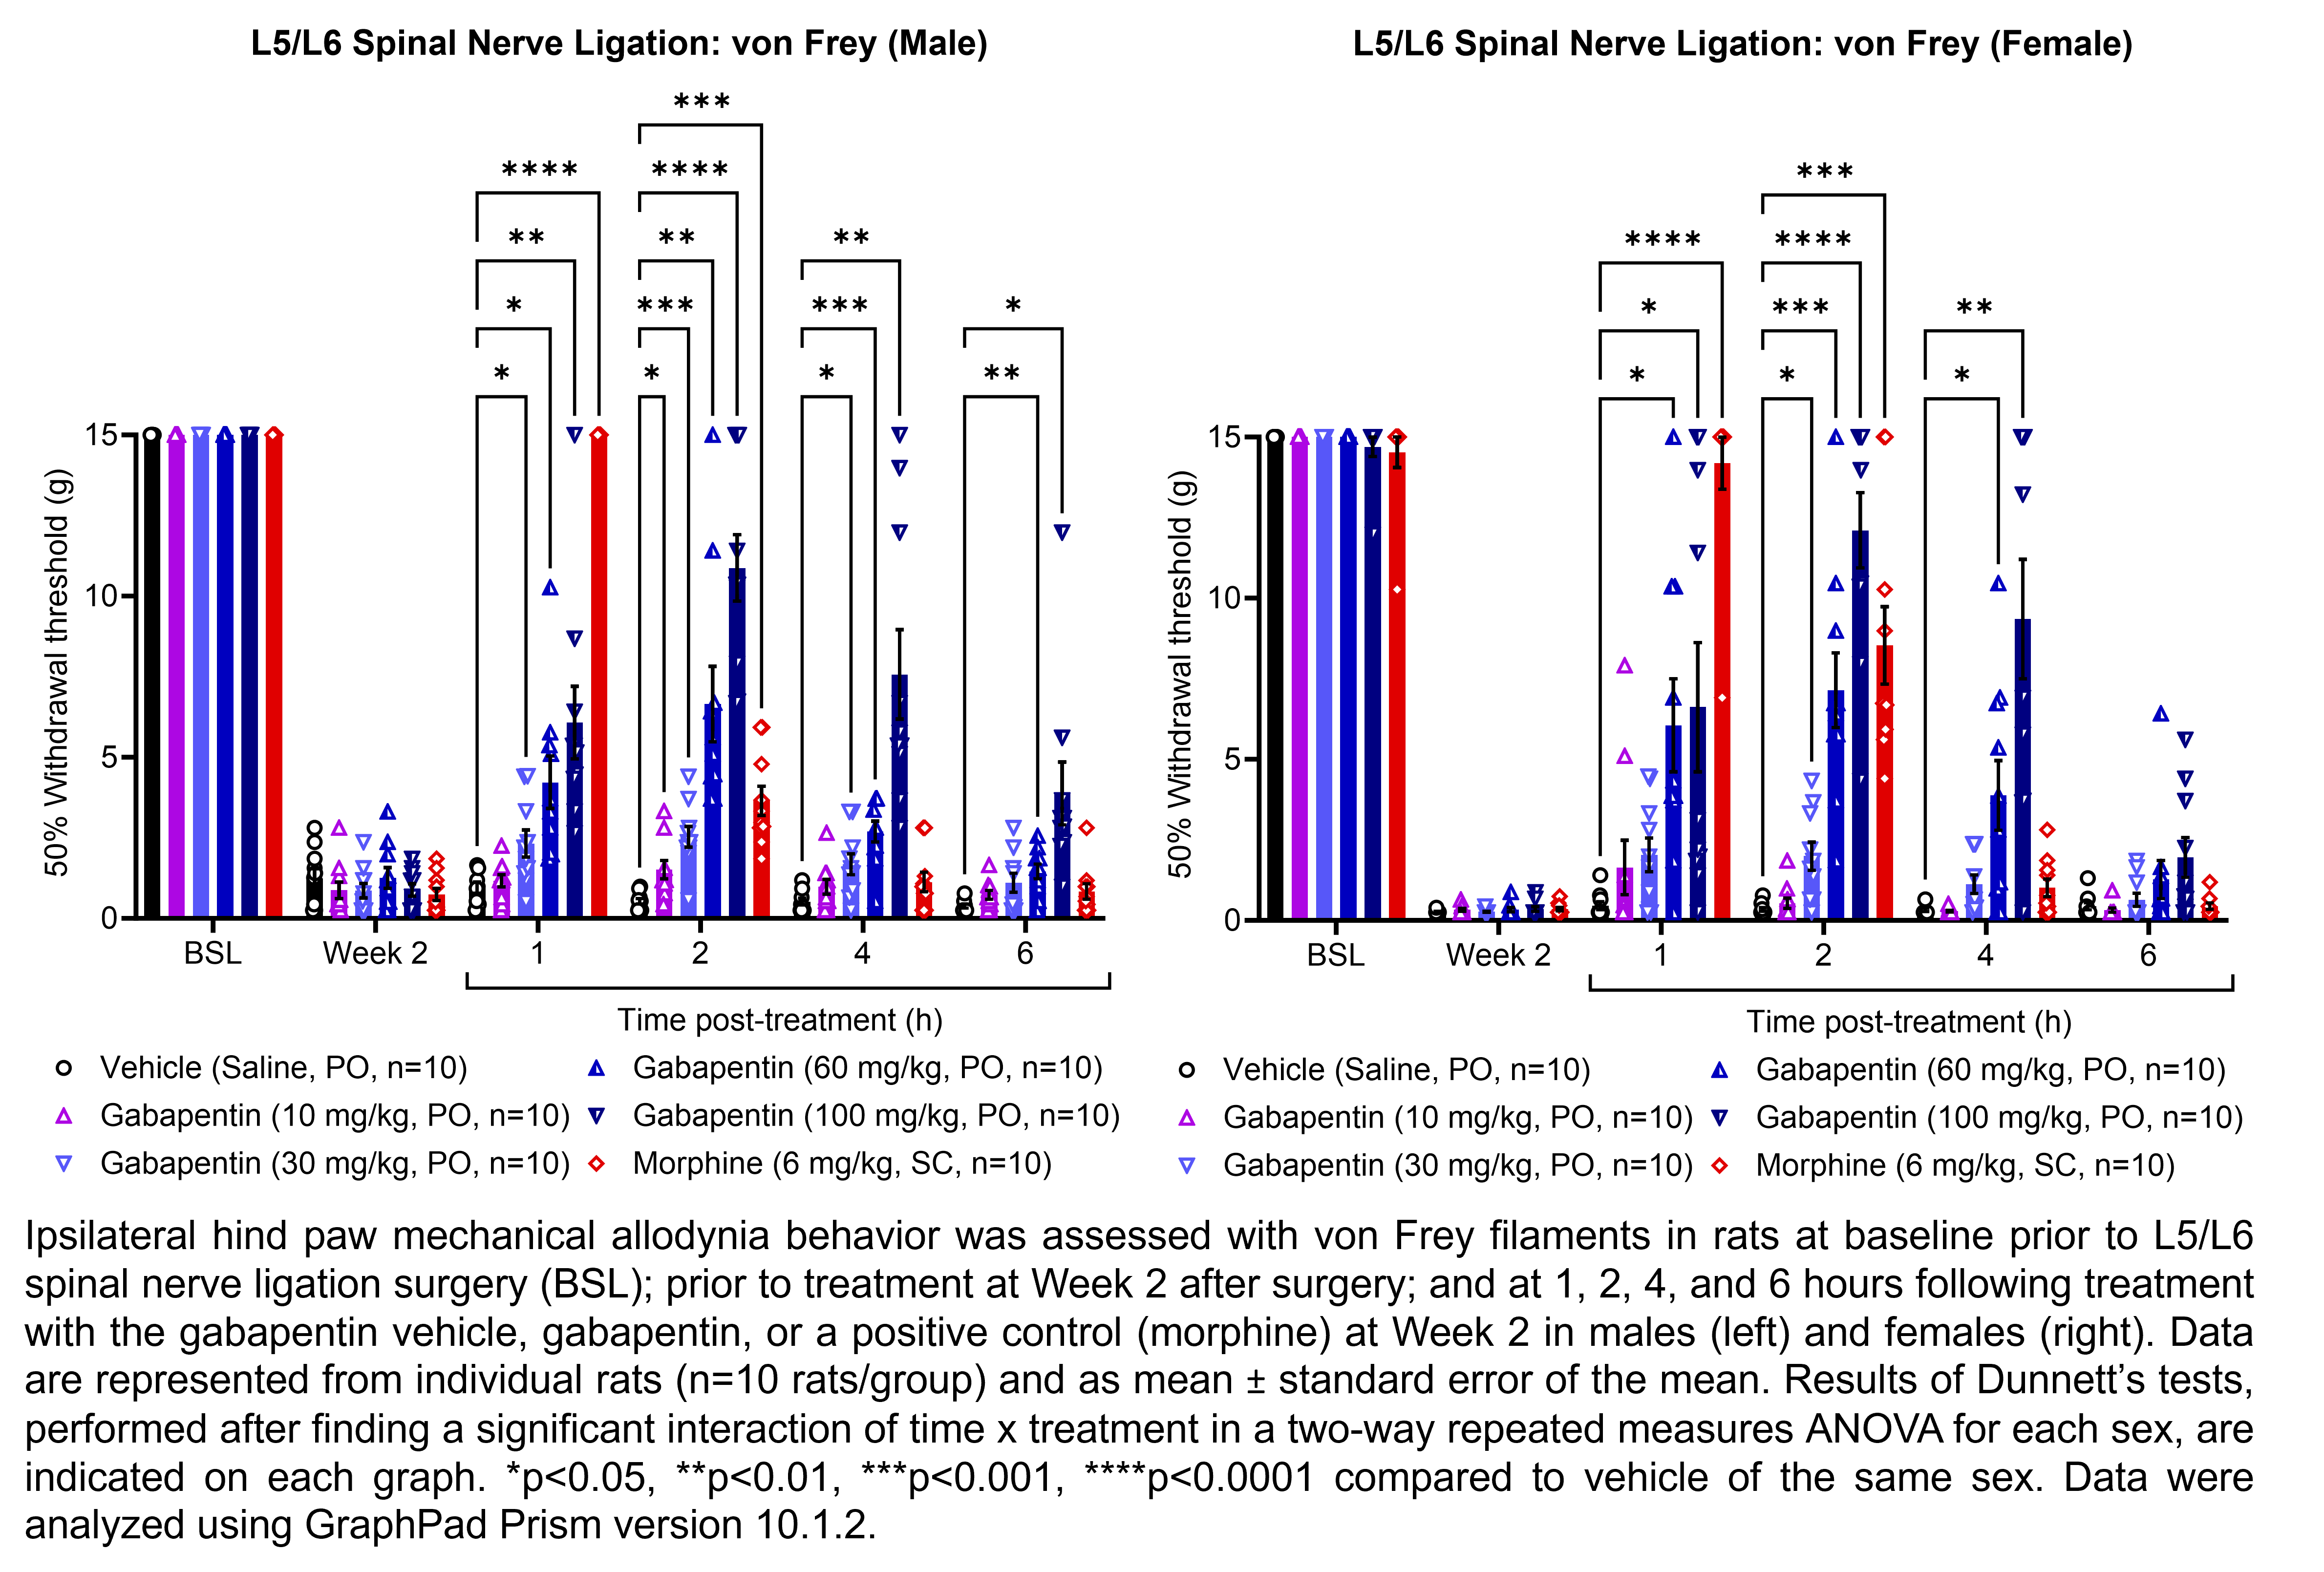
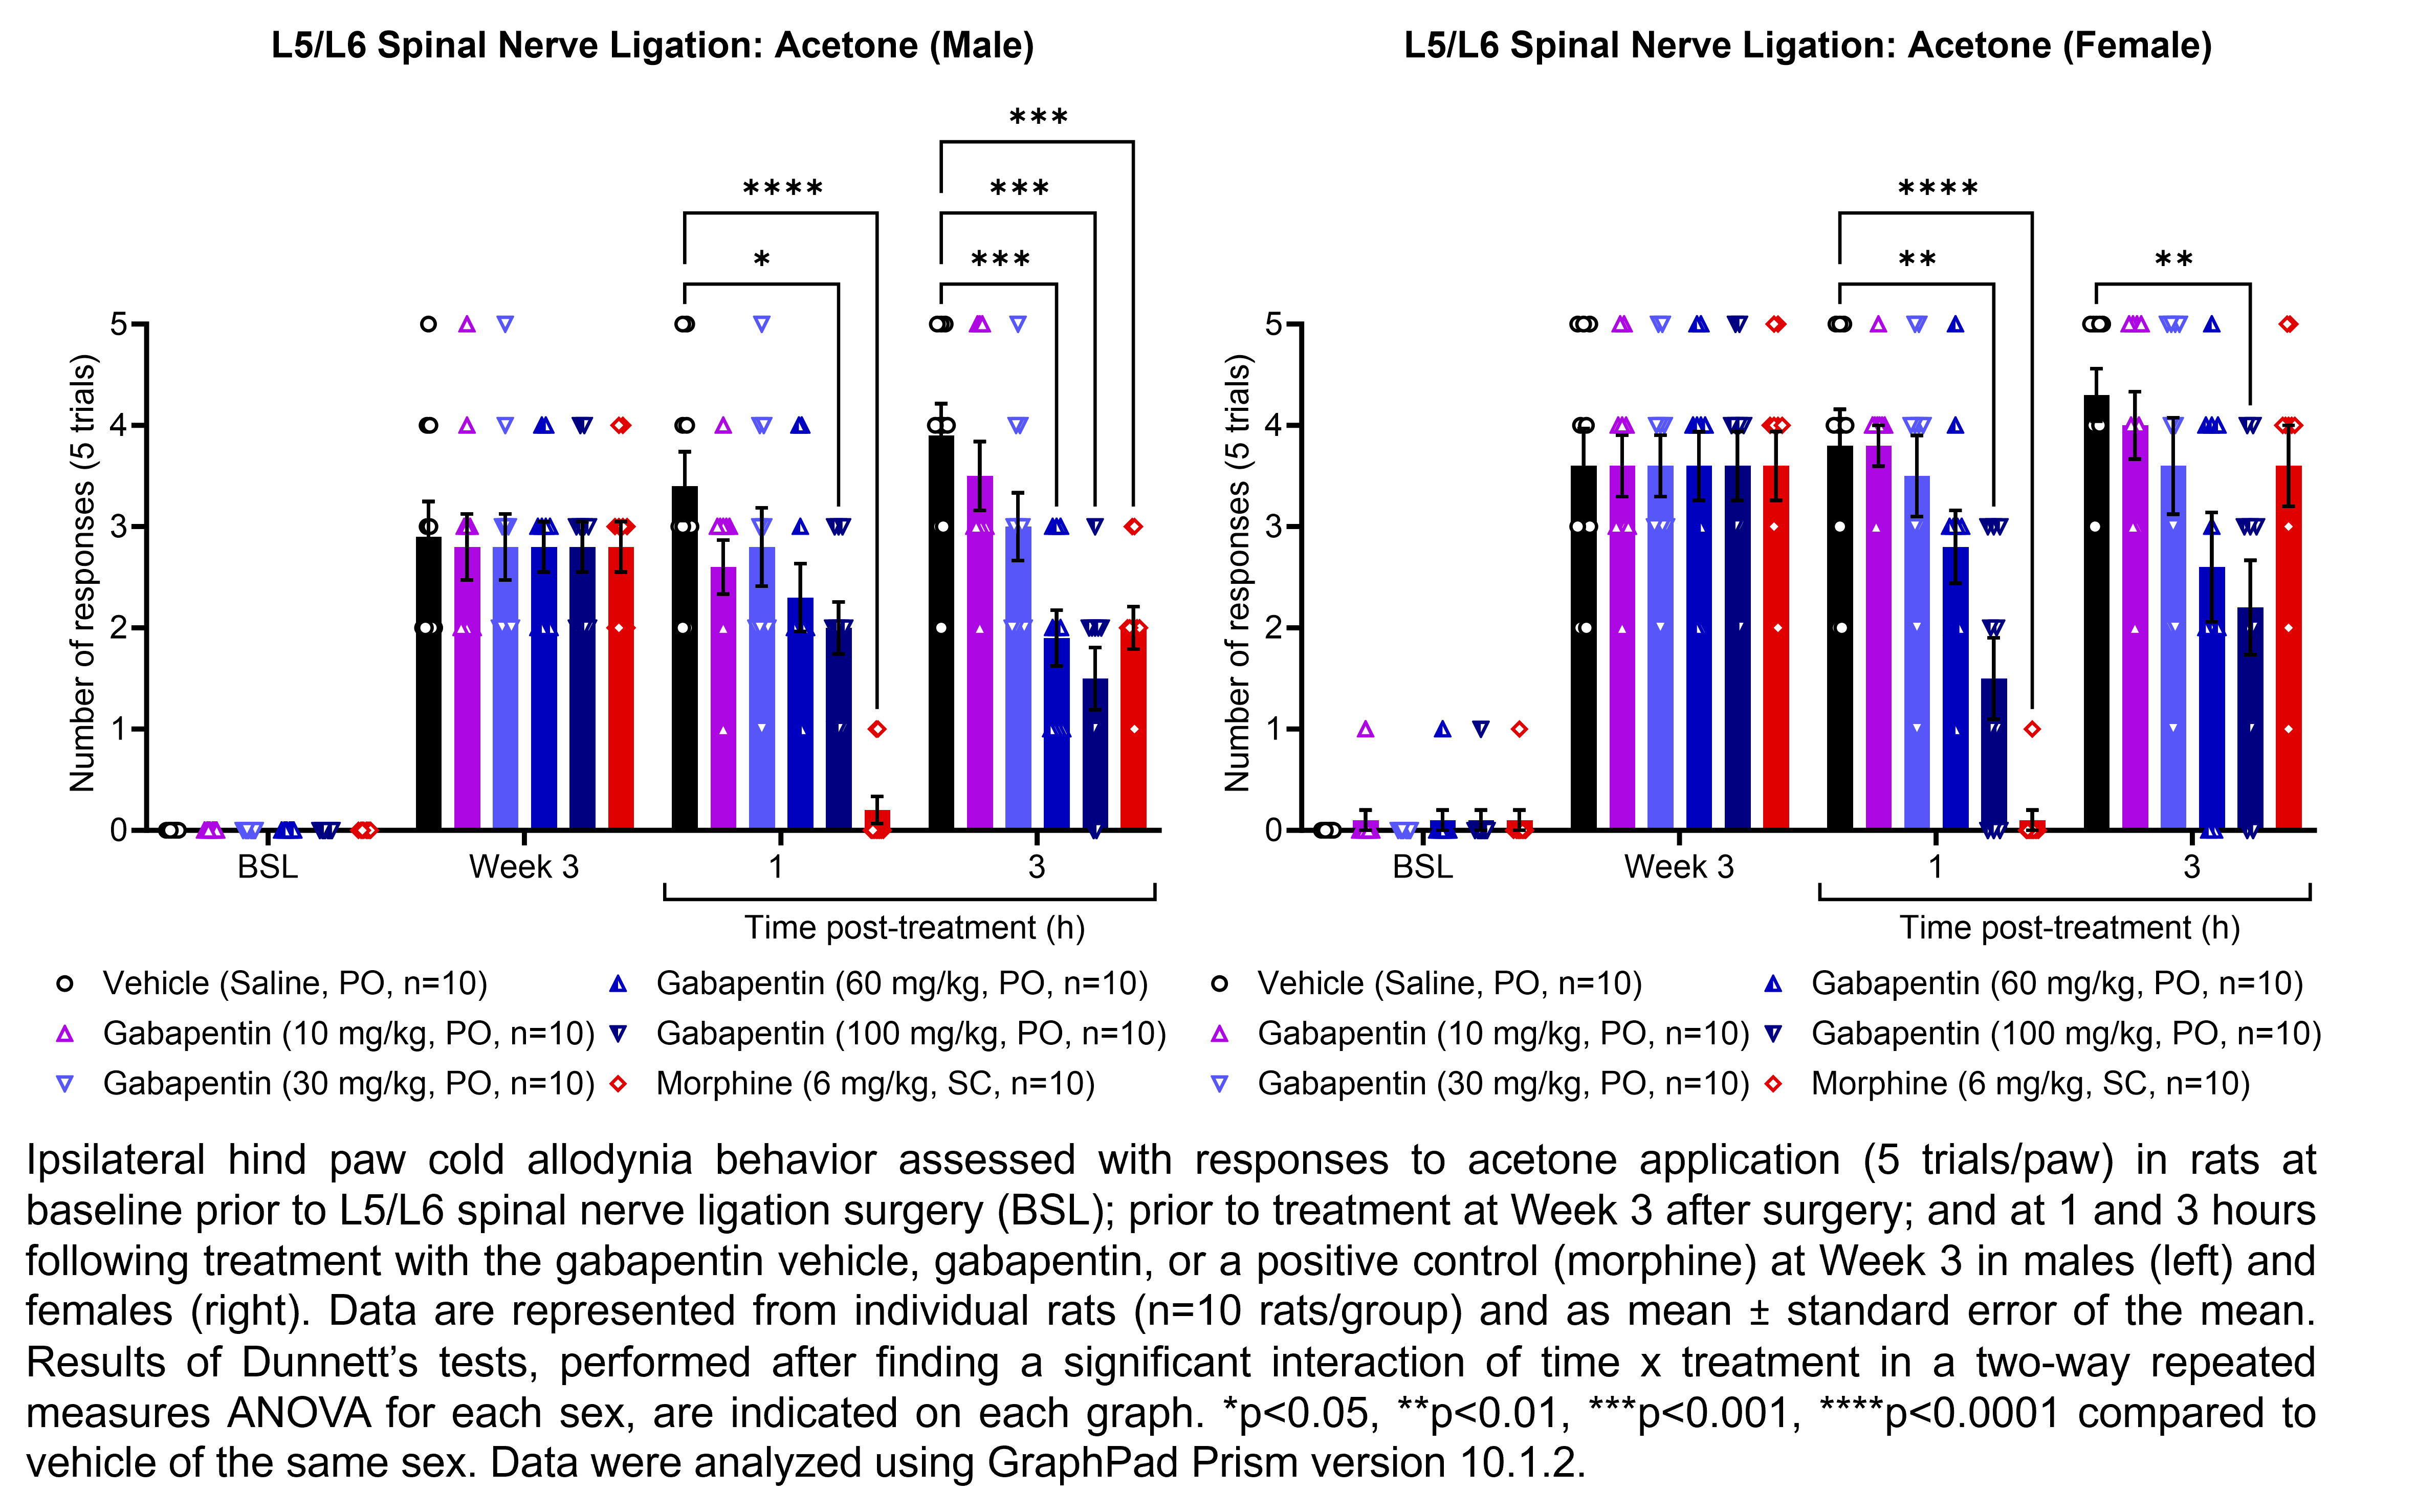
| L5/L6 SNL, | |||||||
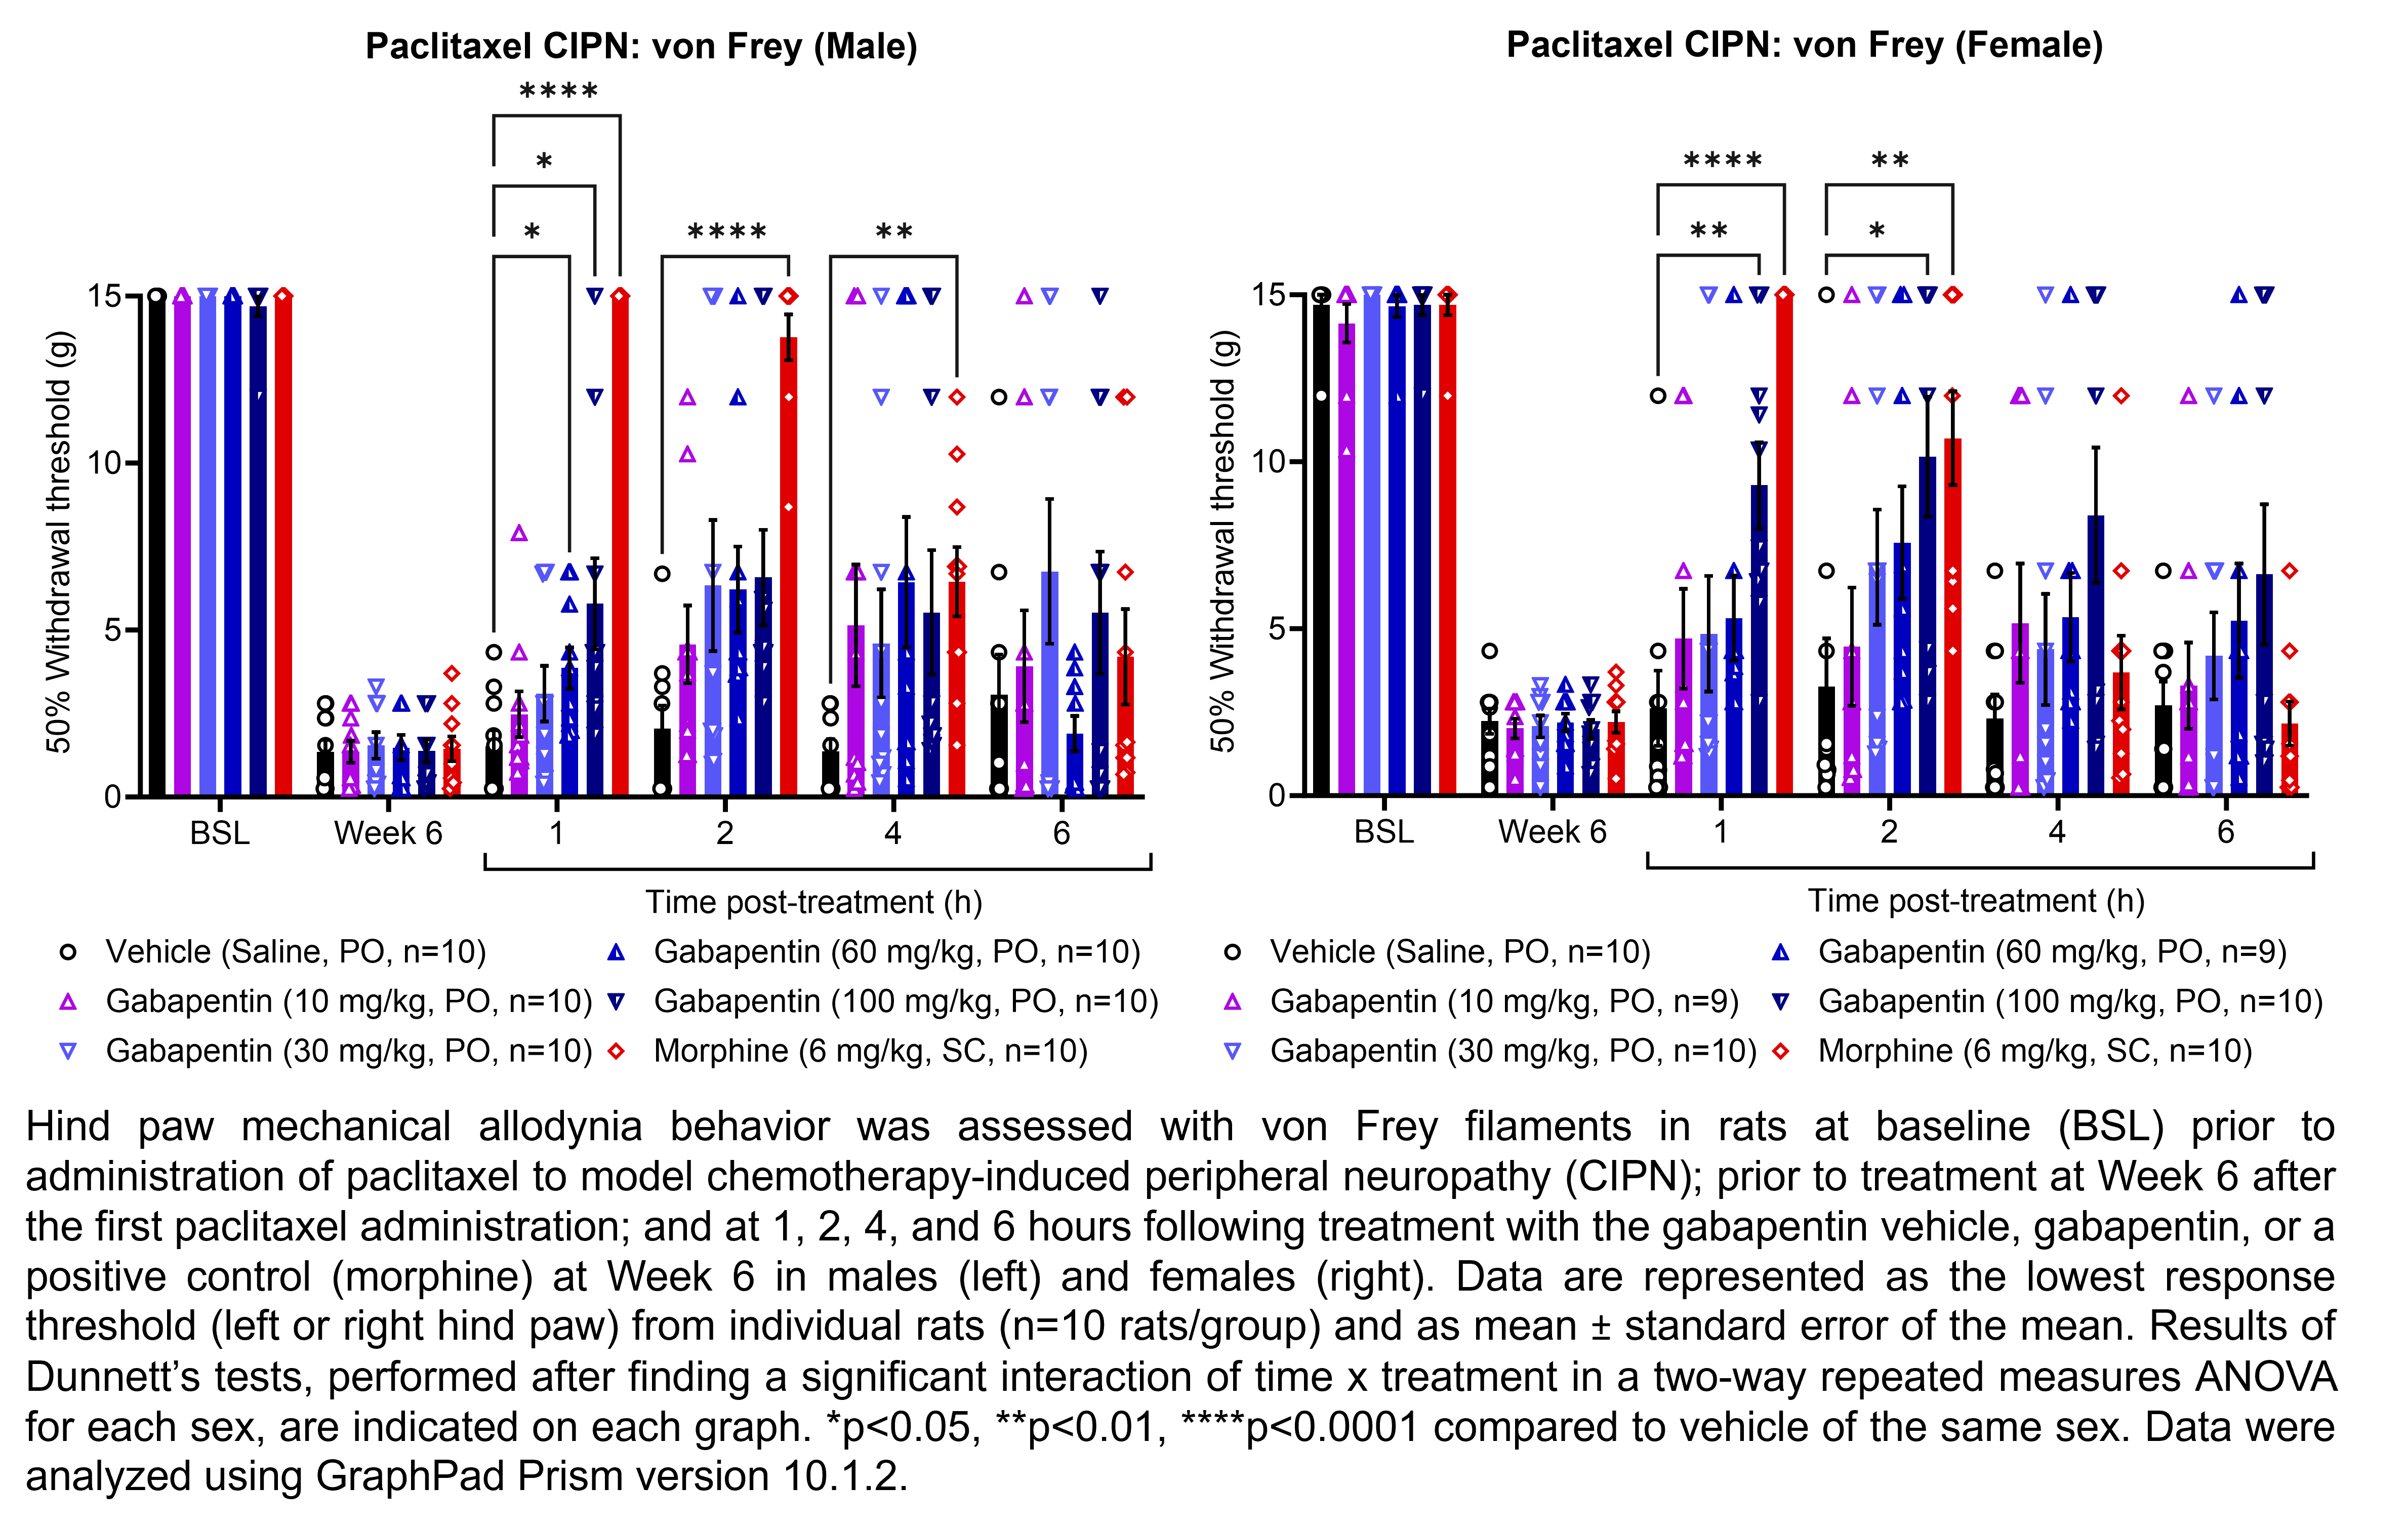
| Paclitaxel CIPN, | |||||||
| Oxaliplatin CIPN | |||||||
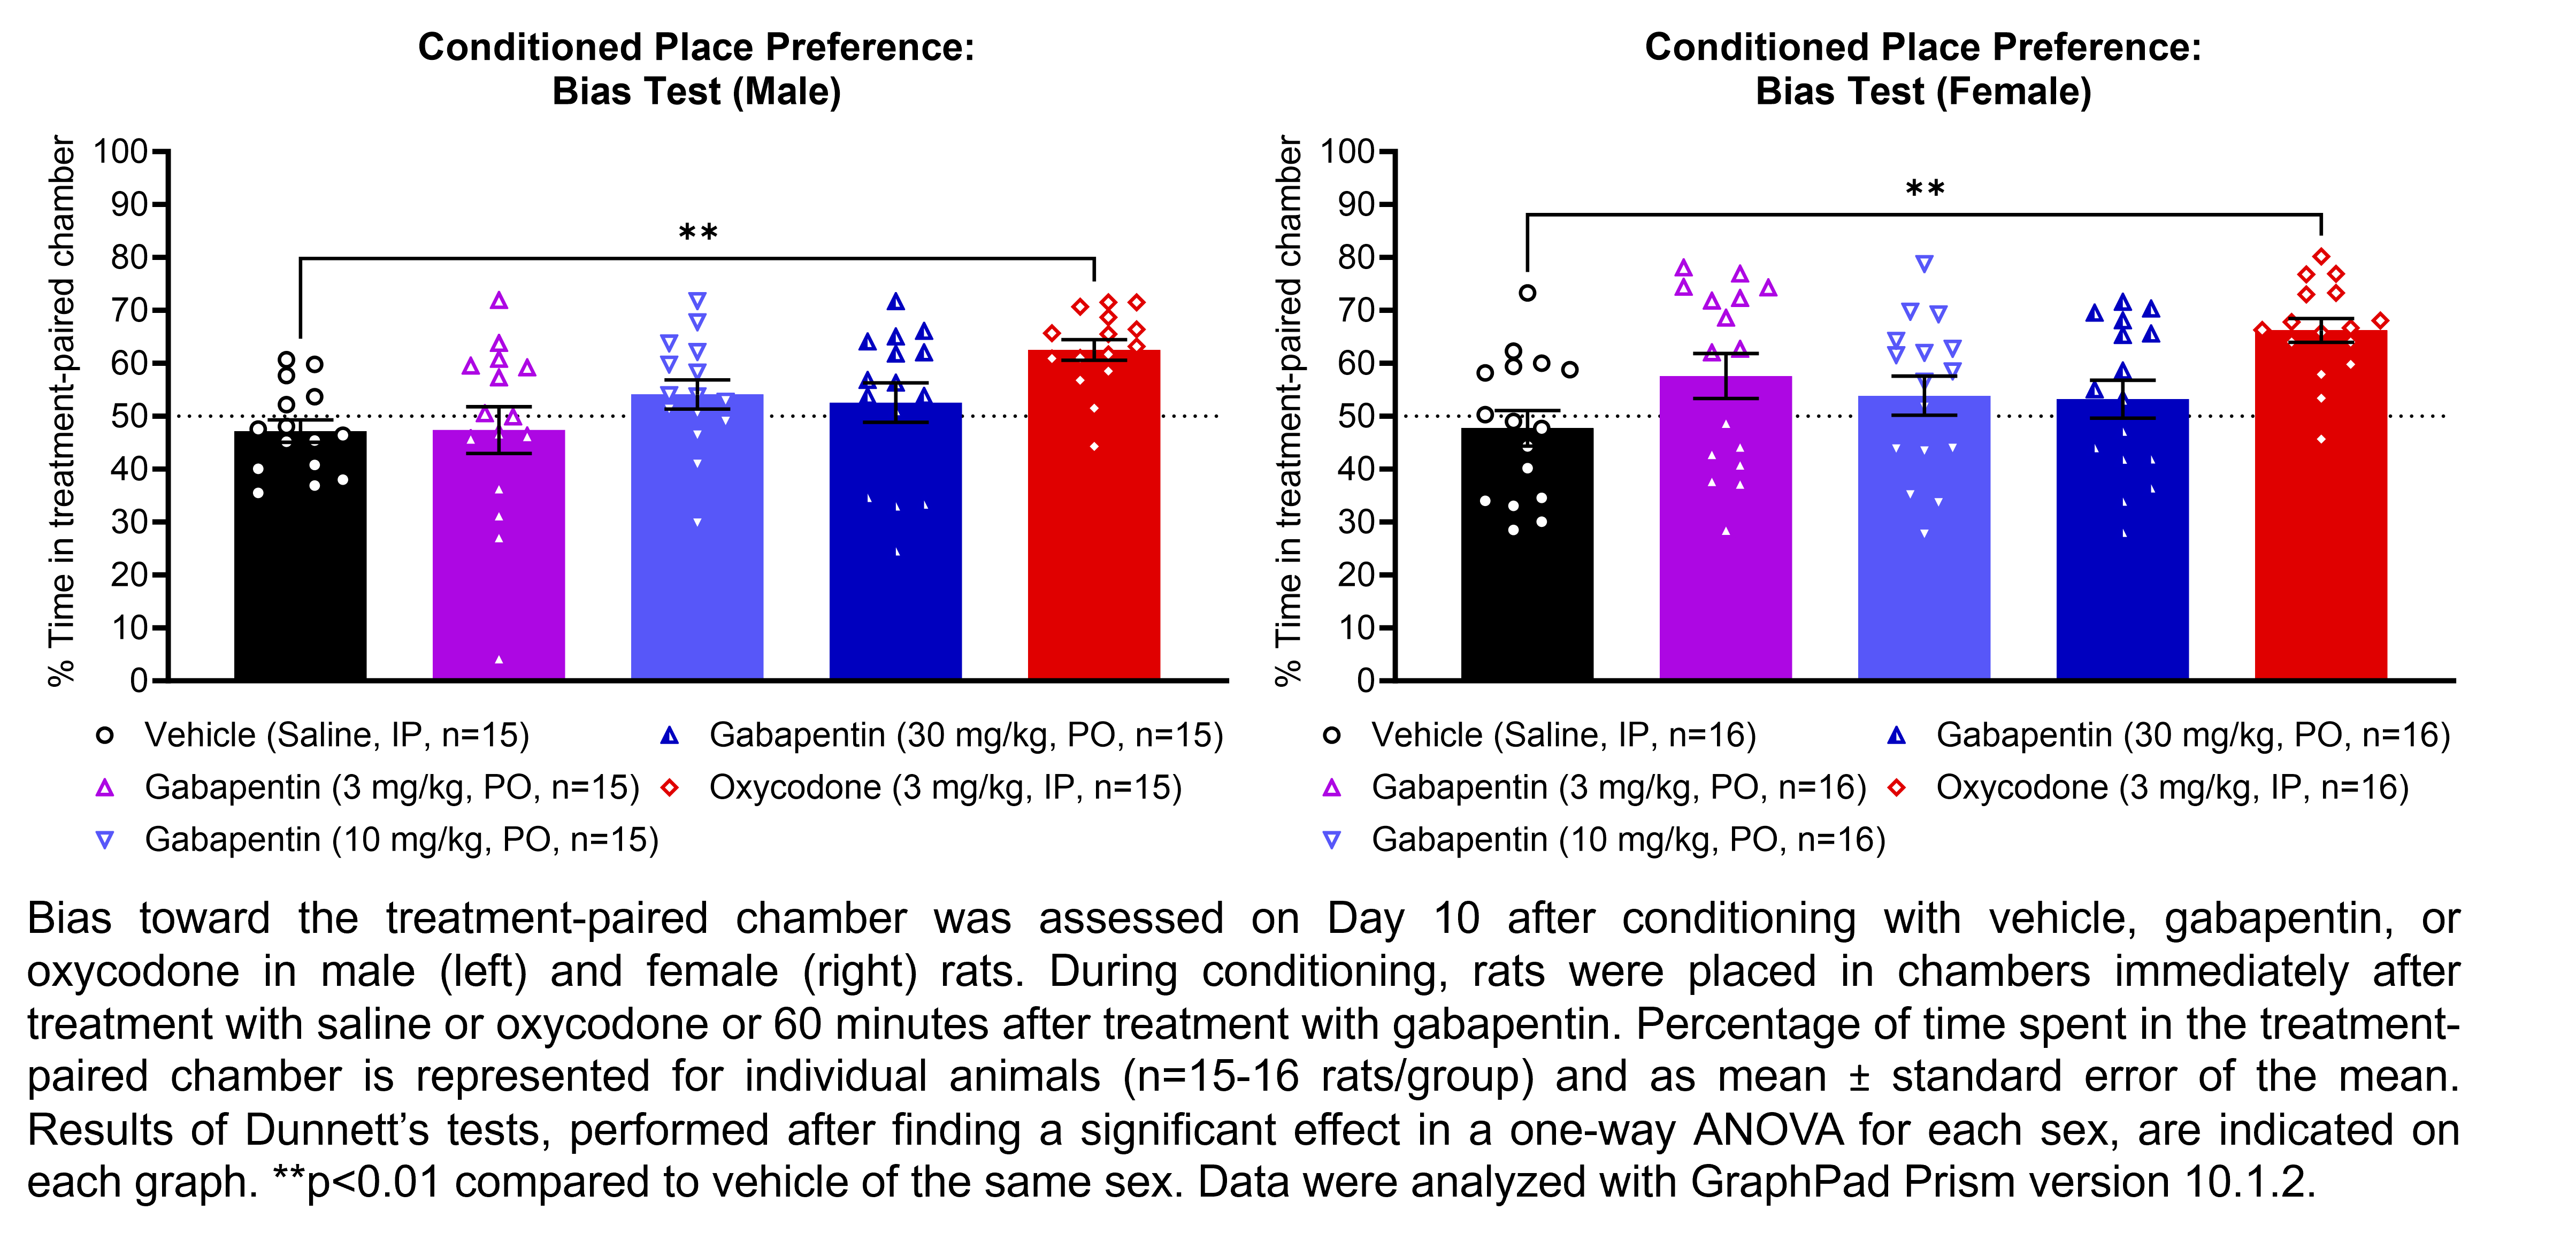
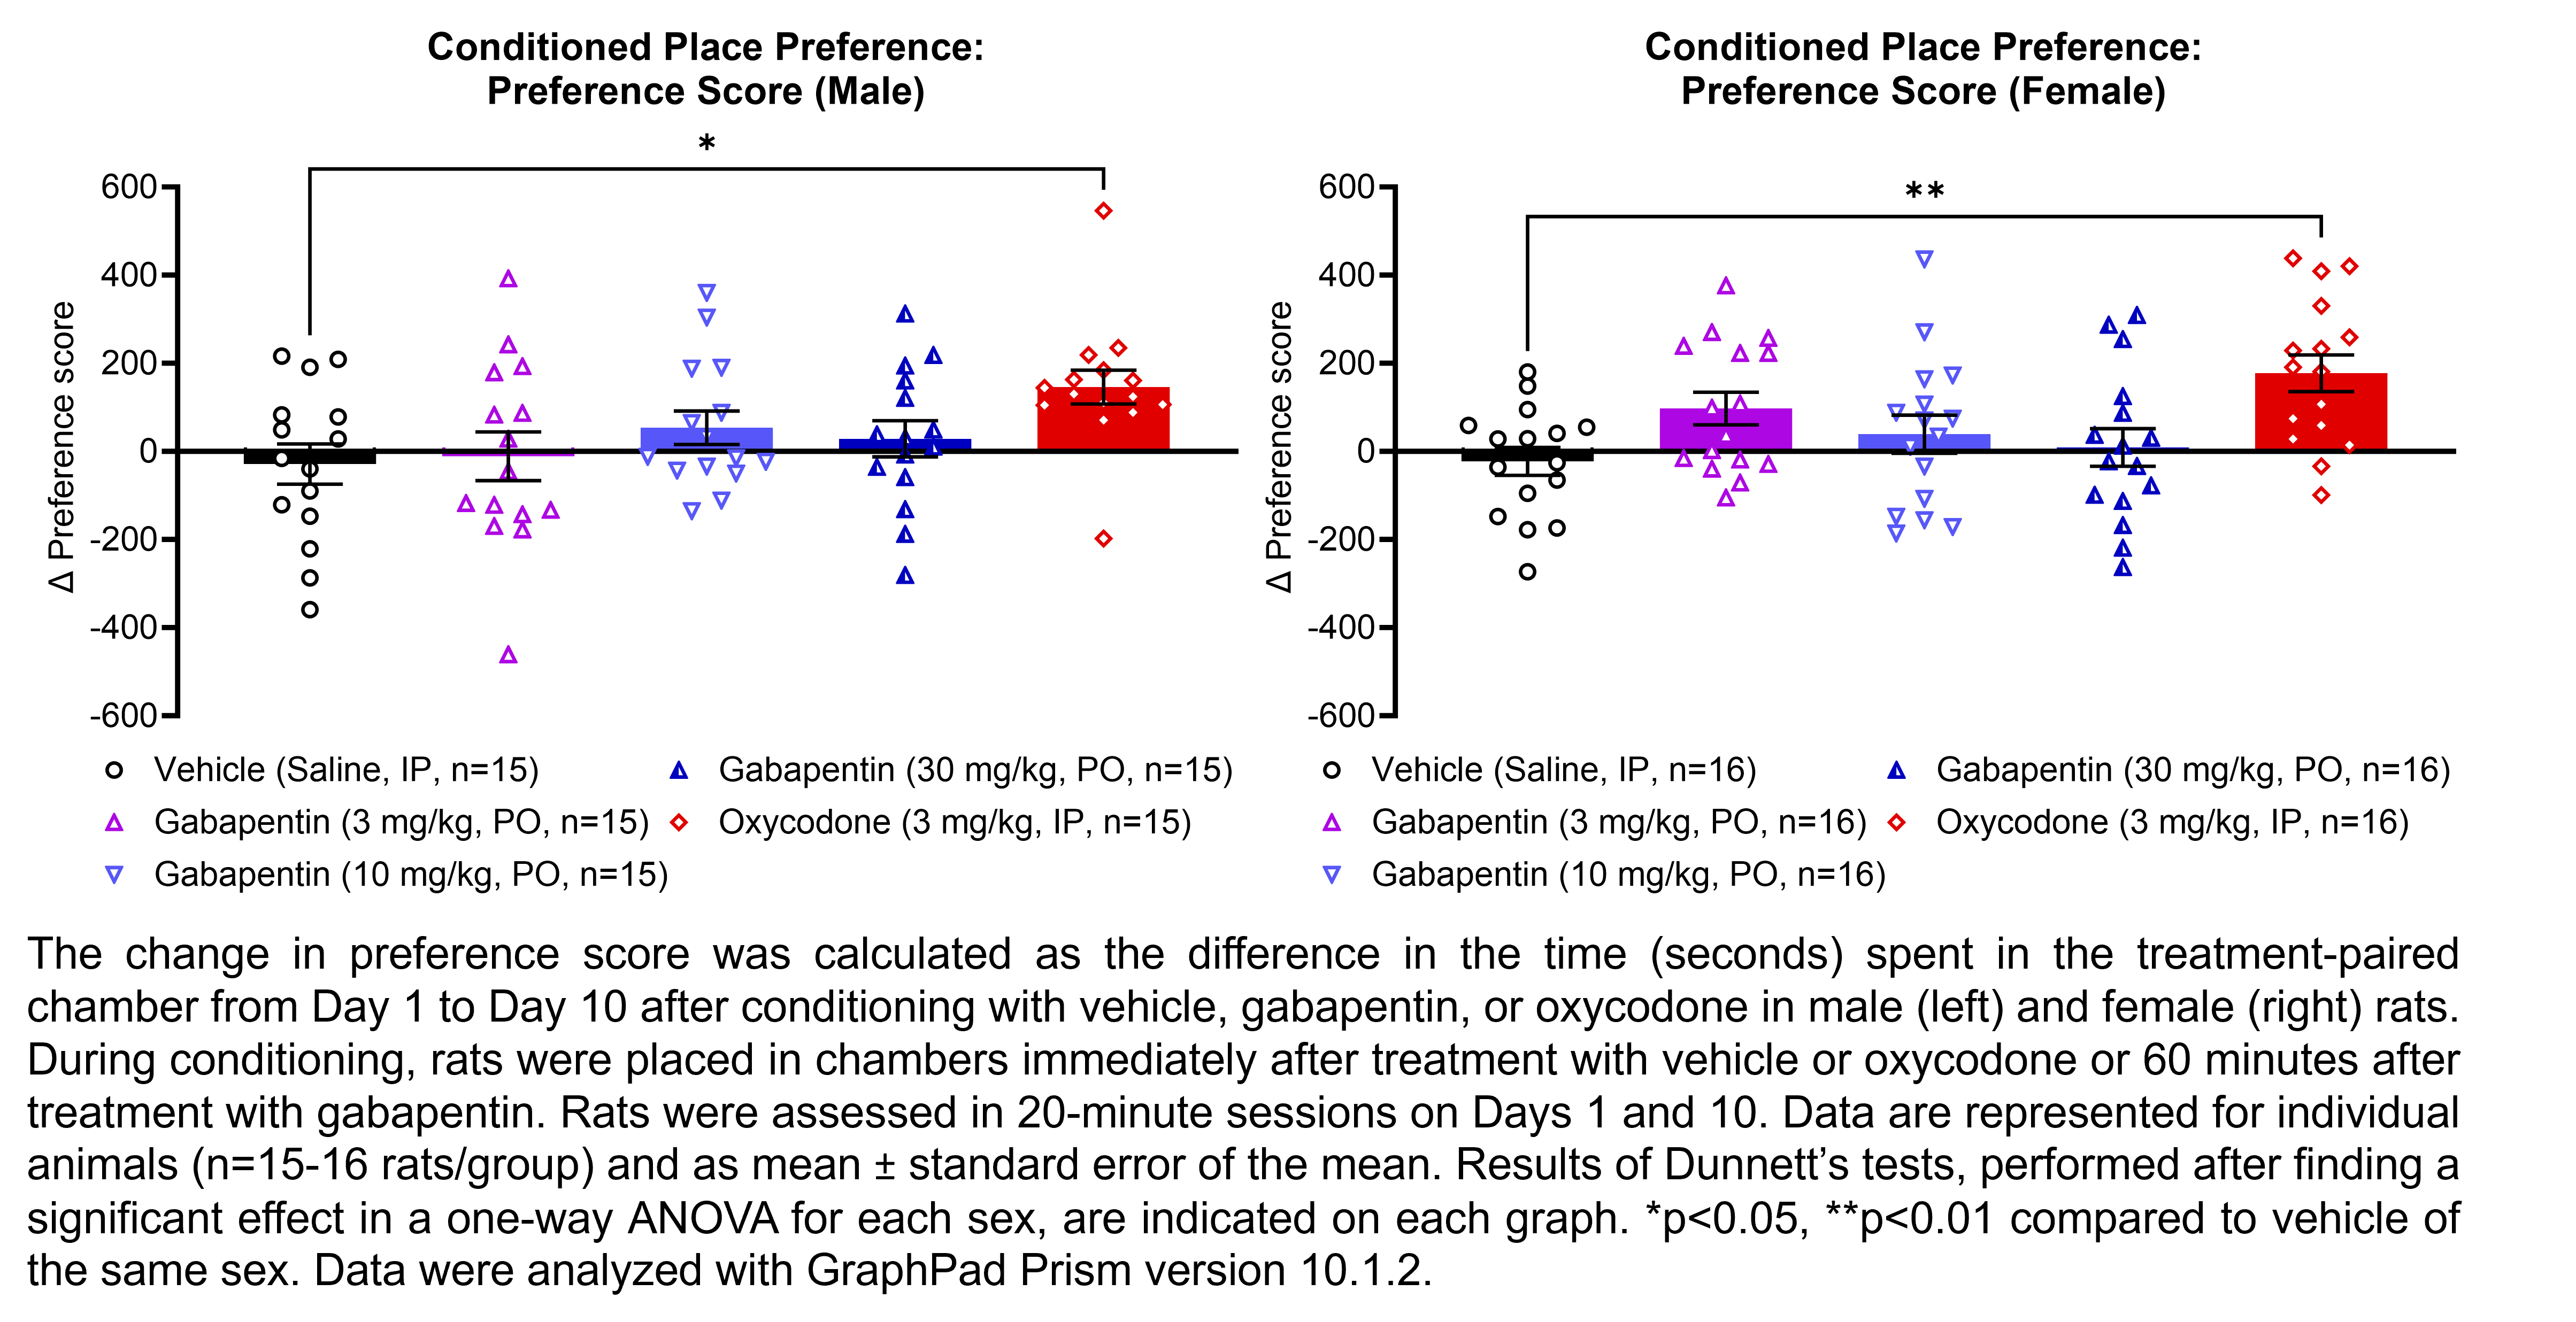
| CPP | Gabapentin | 3, 10, 30 | 1.00 | 5 | PO | Saline | Solution |
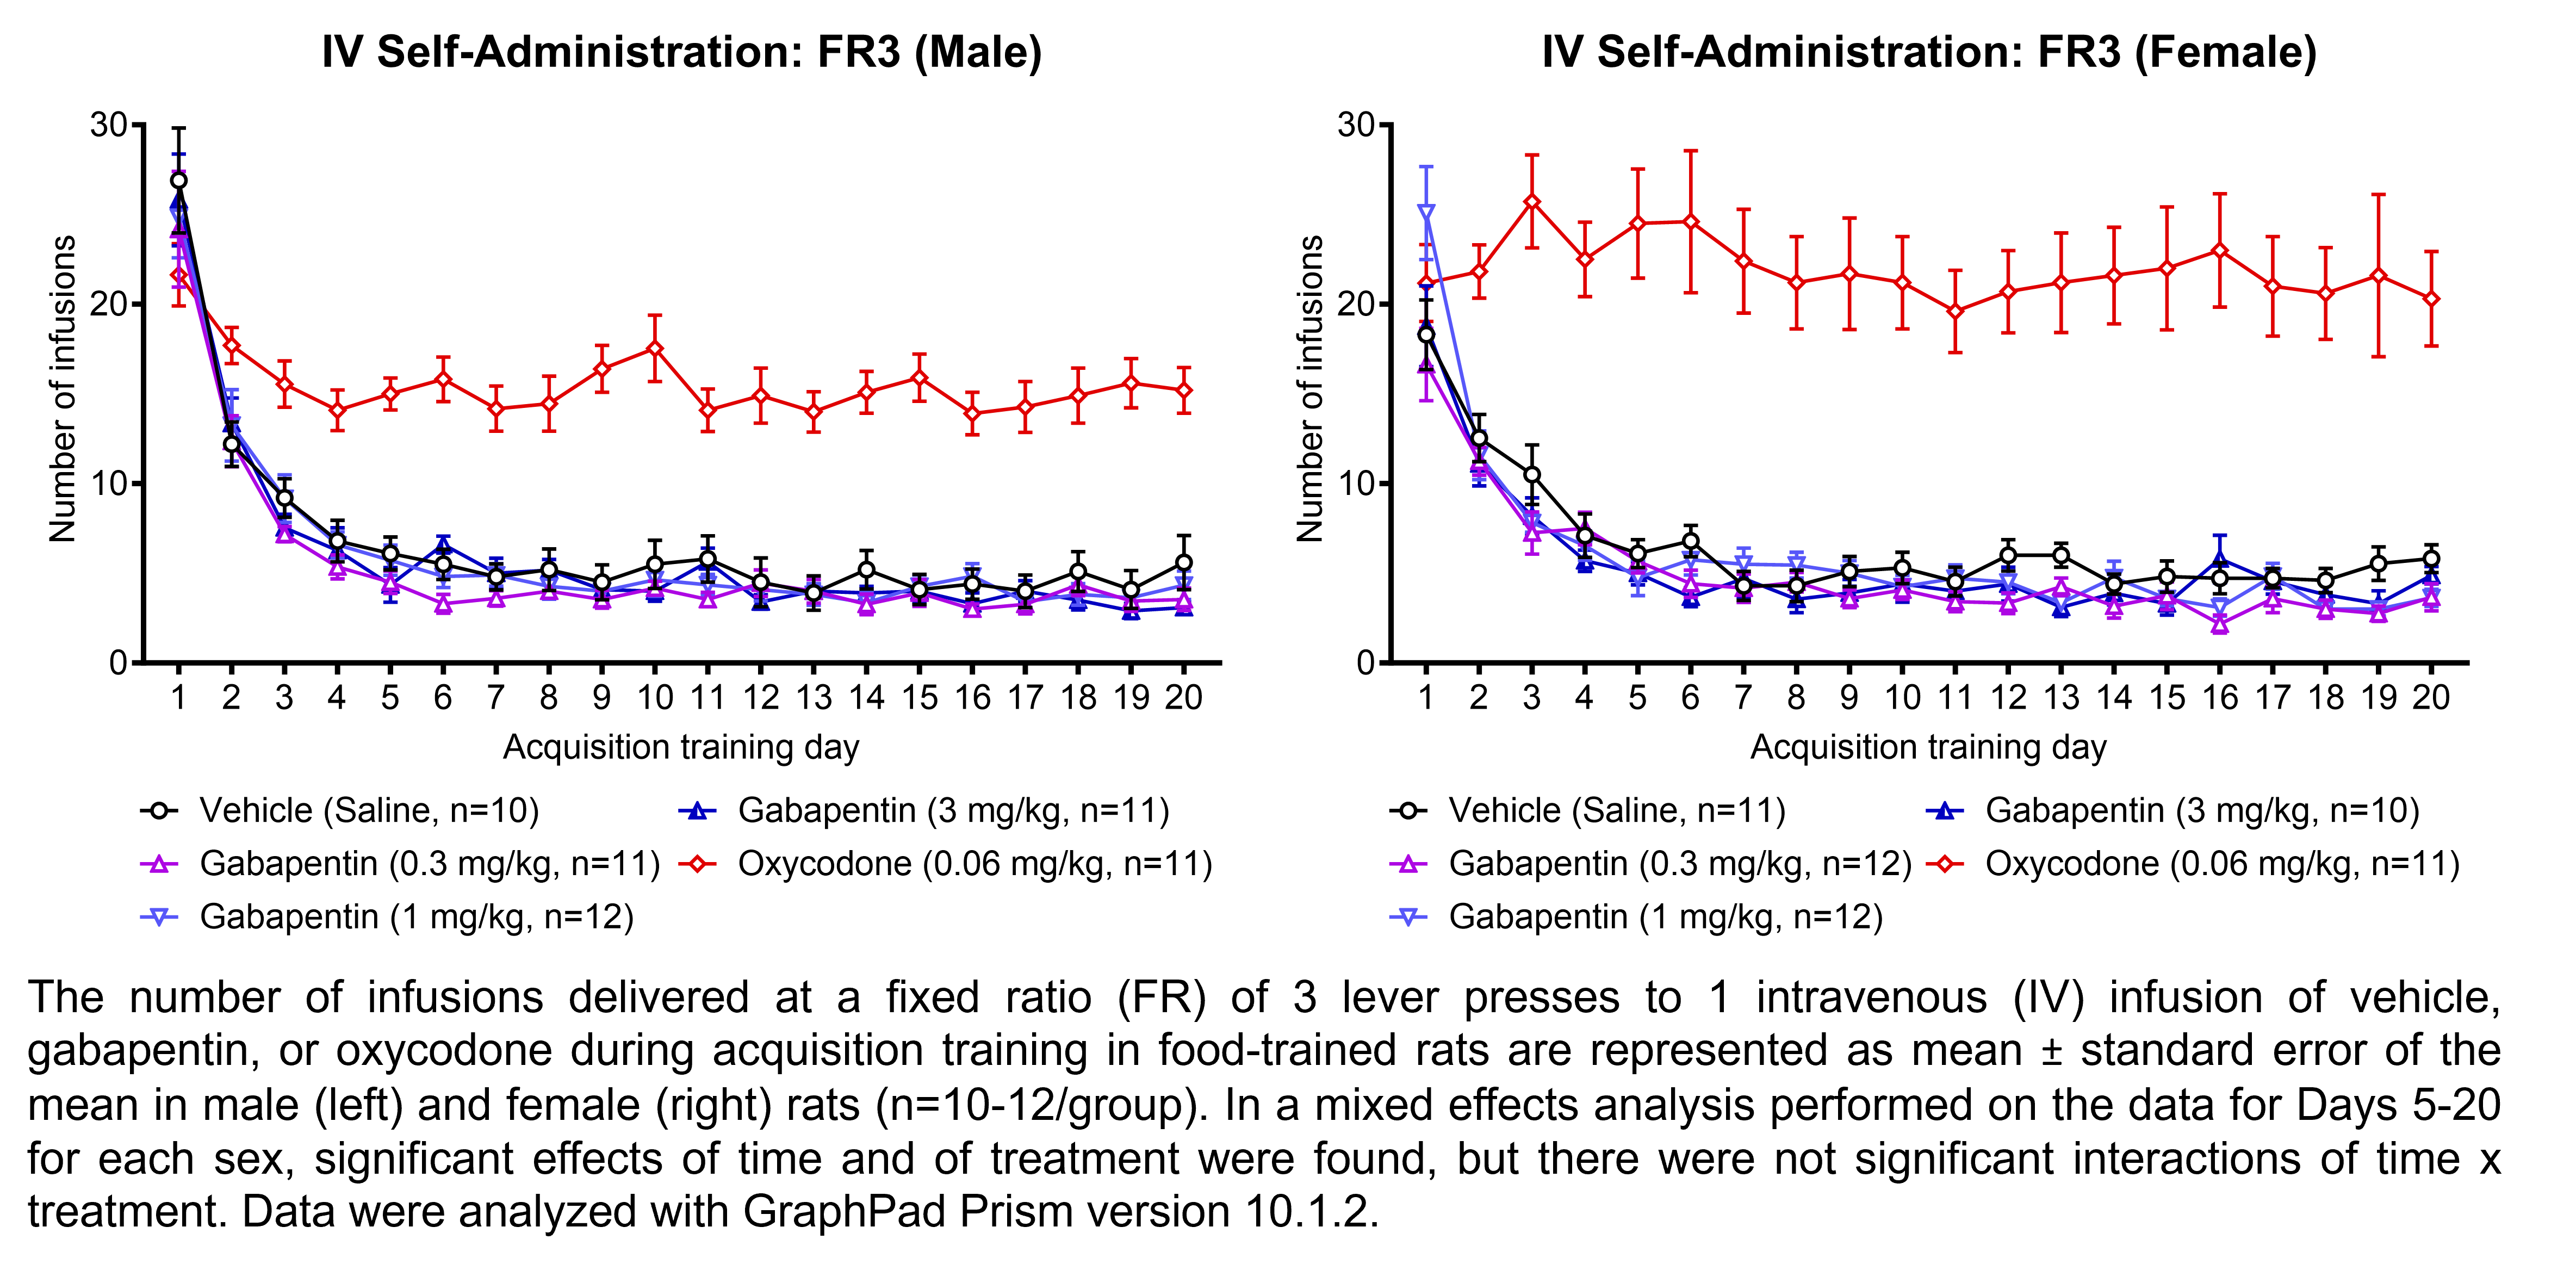
| IVSA | Gabapentin | 0.3, 1, 3 | 1.00 | 0.088 mL/infusion | IV | Saline | Solution |
| mg/kg/infusion | |||||||
| Plantar incision, | Morphine | 6 | 1.33 | 1 | SC | Saline | Solution |
| L5/L6 SNL, | |||||||
| Paclitaxel CIPN, | |||||||
| Oxaliplatin CIPN | |||||||
| CPP | Oxycodone | 3 | 1.12 | 1 | IP | Saline | Solution |
| IVSA | Oxycodone | 0.06 | 1.12 | 0.088 mL/infusion | IV | Saline | Solution |
| mg/kg/infusion |
L5/L6 SNL = L5/L6 spinal nerve ligation; CPP = conditioned place preference; IVSA = intravenous self-administration; PO = per os; IV = intravenous; SC = subcutaneous; IP = intraperitoneal
Results
Expand and Collapse accordion content
This work was conducted by PsychoGenics Inc. (Paramus, NJ) in collaboration with PSPP, NINDS, NIH under contract # 75N95019D00026. Prescribing information for clinically used controls can be found at labels.fda.gov. Information for icons representing experimental design details can be found through the NINDS Office of Research Quality https://go.nih.gov/Yw2tHGI.
